4 Navigation
Navigation isn’t just about finding out where you are - it’s about planning where you’re going. Decision making, both before you go out, and on the water, requires taking a lot of factors into account - for example:
The weather: are conditions suitable for a day on the water? Do we need to seek shelter? Is is better to start by going upwind so we can get blown back at the end of the day? Will the weather change whilst we’re on the water?
Type of craft: This clearly affects how far we might be able to go, and where it is sensible to go. Weather and sea conditions affect different craft in different ways - for example, an offshore wind may be more problematic for a group of SUP paddlers than a group in sea kayaks.
Experience: How experienced and skilled the group are
Leader: The experience of the group leader (if there is one)
Fitness: How far do we want to go? Do we have the fitness to paddle in more difficult conditions - paddling in wind and waves requires much more effort than flat water.
Launching and landing: Where can we get on and off easily? Does this depend on the tide
Places to stop: Where can we get off the water for a break or in an emergency?
Car parks: Where can we park near the water?
Aims and aspirations: What do we want to see on the water? What are we looking to achieve?
Notice that many of these factors relate to the geography of the paddle, and we’ll likely discuss them whilst looking at a map.
4.1 Practicalities*
4.1.1 On the water
The limited space available on a kayak deck means that we need to give some thought to how we organize ourselves to navigate on the water.
4.1.1.1 Waterproofing
Neither a map nor a chart is much use if it’s soaked in seawater and falling apart. It’s clear that you’ll need to do something to keep your map or chart dry if you’re going to use it at sea on the deck of a kayak. There’s more information in the ‘Practicalities’ section, but basically your options are to:
Place the map in a waterproof map case. Beware - most map cases are designed to withstand a bit of rain, not the complete immersion possible on a sea kayak deck! Many paddlers used to swear by the ‘Axel pack map case’, but this no longer seems to be available. I’ve got no specific recommendations (other than to test whatever you decide to use thoroughly), although Whetman Equipment, who usually make excellent kit, do offer one.
Buy waterproof maps and charts. OS maps are available laminated, but these are only described as ‘weatherproof’. Some Imray charts are available laminated.
Laminate them yourself. This is time consuming, but allows you to cut your maps and charts to the size you want, and make use of printouts where these are available.
Given that neither laminating or map cases can be relied on to be perfectly waterproof, I’d suggest using both methods - placing laminated maps in a waterproof map case. Another advantage of laminated maps is that you can make notes on them with OHP pens - these notes can later be removed with isopropyl alcohol, alcohol wipes or whisky.
4.1.1.2 Carrying maps and charts
Many kayakers place their map under their front deck elastics. I find that a map placed there is too far from me to read, so I prefer to keep my map closer. I uses a spray deck with elastics to which I’ve attached a map case.
4.1.1.3 Other equipment for the boat
It’s useful to carry some other navigation equipment in the boat:
A baseplate compass.
Chinagraph pencil (and possibly OHP pen) for making notes on maps, or even the kayak deck.
A GPS unit - although I rarely use mine, it’s a good backup in poor visibility and it allows position to be given very precisely in the even of needing outside assistance.
It’s useful to keep this equipment to hand - perhaps in a buoyancy aid pocket, or a small hatch in front of the cockpit.
4.1.1.4 My setup
There’s lots of options for how and where to carry navigation equipment when you’re out on the water. Here’s what I choose to do:
I carry laminated sections of map 26cm x 26cm in an Ortlieb map case. This holds the map securely in place and provides 2 waterproof barriers. Whilst the map case isn’t all that waterproof by kayaking standards, I can use a non-waterproof map on sunny days with flat water. It turns out that this size of map can be stored in boxes designed for vinyl records.
The map case eyelets are threaded onto the shock cord of my Peak Explorer spraydeck. A spraydeck mounted chart case keeps the map close enough to be easily readable – for boats like my Cetus that have a small hatch in front of the cockpit, it would otherwise be a long way forward. Also, the map is always with me when I’m out of the boat.
If there’s any substantive navigation to be done, I’ll carry a hiking compass in a buoyancy aid pocket, with the loop of cord attached to the waist strap on the buoyancy aid with a larks foot knot.
My boat has a steering compass - I use it to check my direction when following coastlines as well as when following bearings in open water.
The small hatch in front of me contains a chinagraph pencil, and OHP pen and a GPS unit. The GPS unit only comes out for crossings in fog or when I want a precise and certain grid reference - e.g. for the coastguard. The chinagraph pencil is good for scribbling notes on the boat - especially when listening to weather forecasts over VHF.
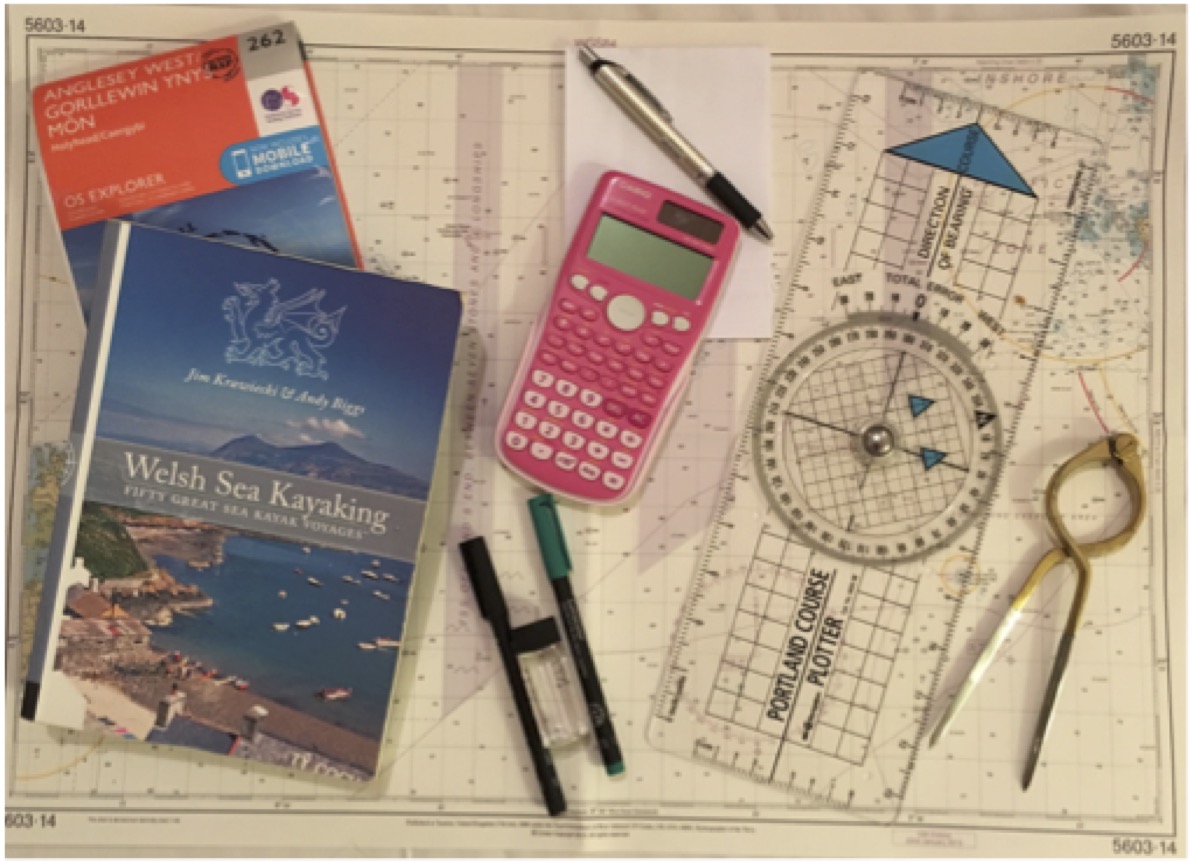
4.1.2 On dry land
In addition to the simple equipment carried in the boat, it is helpful to have some items with you on the trip for evening planning. These might include:
- Larger maps and, possibly, charts to give an overview of the area
- Sources of tidal information – tide times, pilots etc.
- Portland plotter (like a big hiking compass, only really necessary for advanced work)
- OHP pens for marking up laminated maps
- Isopropyl alcohol (or whisky!) to remove OHP pen annotations
- Pen, pencil and scrap paper for tidal calculations
- Calculator (if mental arithmetic is poor and you want to be precise)
- Smartphone – great for weather forecasts and tide times.
4.2 Maps and Charts
Sea kayakers use two sorts of maps – normal ‘hiking’ maps (mostly produced by the Ordnance Survey in the UK) and nautical charts.
4.2.1 Comparing maps and charts
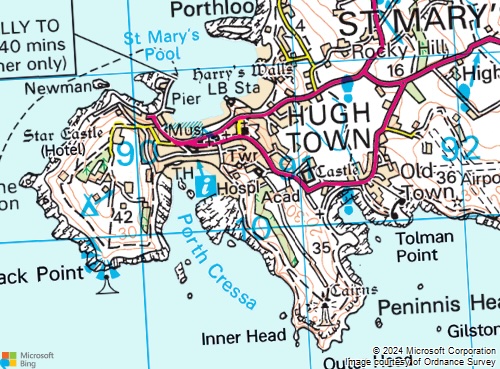
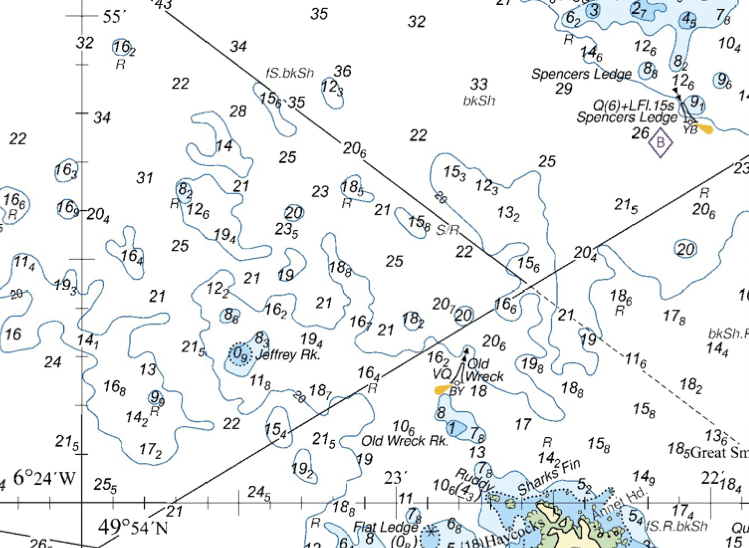
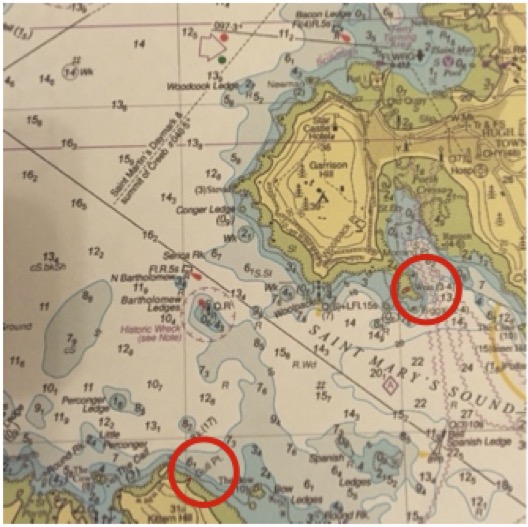
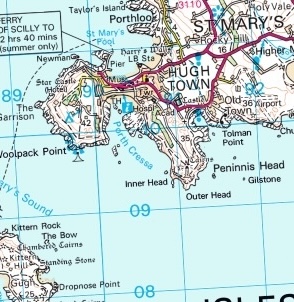
For comparison an OS map and a nautical chart of the same area are shown below:
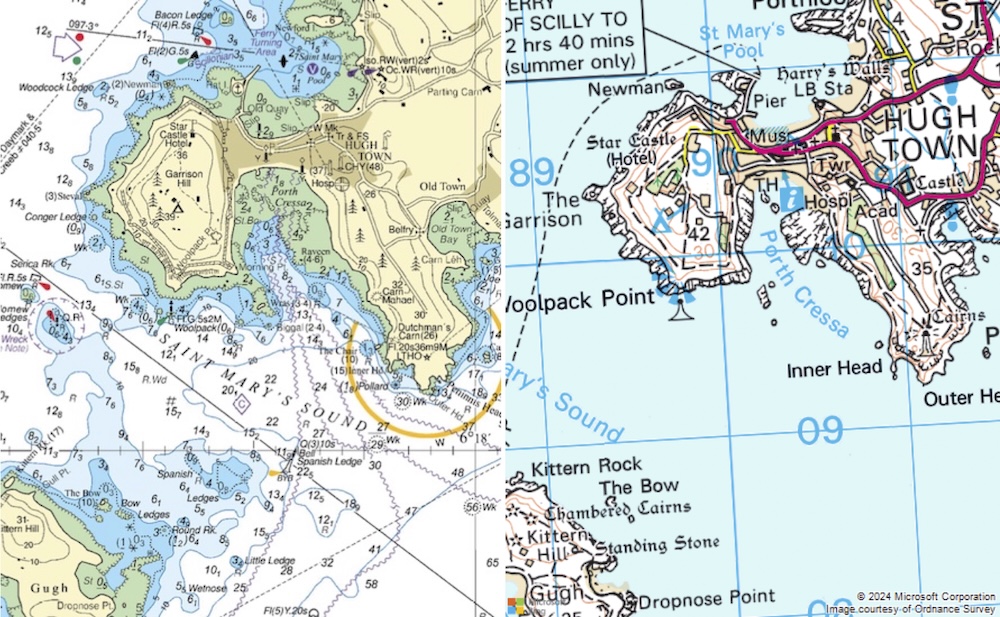
Chart © Crown Copyright and/or database rights. NOT FOR NAVIGATION. Reproduced by permission of the Controller of Her Majesty’s Stationery Office and the UK Hydrographic Office (www.GOV.uk/UKHO). OS map Contains OS data © Crown copyright and database rights.
Notice the difference in emphasis between the maps. The OS map shows great detail on the land, but shows the sea as a uniform blue. By contrast, the chart shows only basic detail of the land (only the features easily identifiable from the sea), but gives much more information about the sea.
The advantages of charts are that they show:
- Details on the depth of the seabed, which is useful in understanding likely conditions and important if falling tides might expose significant areas.
- The positions of buoys and other navigational marks – useful especially for navigation across open water and at night when these are lit.
- Tidal information.
- Greater detail of the exact shape of the coastline and islands, if a large enough scale is available.
However, the chart is useless for navigating on land to find the put in, or in case of an unplanned landing. Also, close in to many coastlines, large-scale OS maps (especially the 1:25,000 series) show many details that can make navigation easier for a kayaker. OS maps are also more readily available than charts.
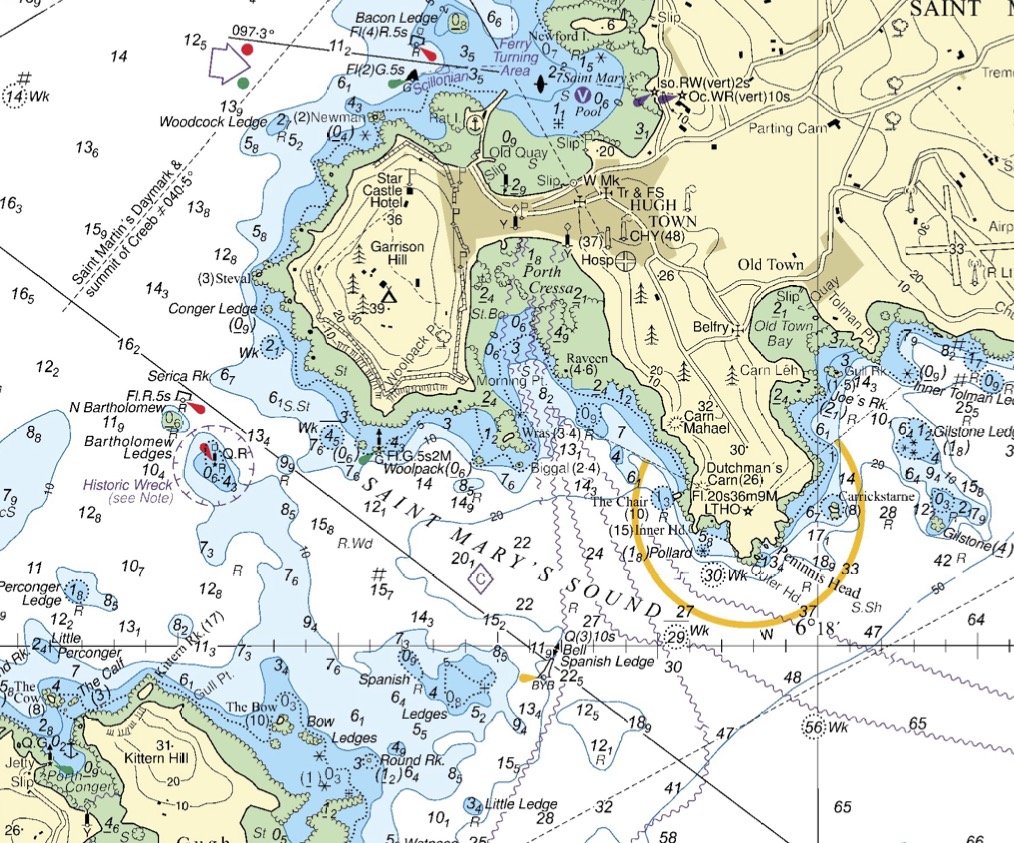
4.2.2 Reading charts*
Nautical charts use a bewildering array of symbols to convey information. The full list is found in a book ‘Symbols and Abbreviations Used on Admiralty Paper Charts’, also known as ‘Chart 5011’. However, sea kayakers only need to know a small proportion of these symbols.
Land on charts, above springs high water, is colored yellow. Deep sea appears as white, with blue used for shallow areas. Green is used to indicate parts of the seabed that can dry out at low tide, but which are covered at high water on a spring tide.
The numbers that cover a chart are depths. Underlined numbers are drying heights – i.e. how high that place will be above the water at a low tide. Both depths and drying heights are measured with respect to the ‘chart datum’ - generally the level of the lowest possible (astronomical) tide. The chart datum is the same as the zero used for tide tables.
Wiggly lines on charts, looking like waves, are used to indicate areas of rough water. Arrows are used to indicate tidal stream directions. Buoys are illustrated on charts using symbols that look like the shape of the buoy.
Charts © Crown Copyright and/or database rights. NOT FOR NAVIGATION. Reproduced by permission of the Controller of Her Majesty’s Stationery Office and the UK Hydrographic Office (www.GOV.uk/UKHO)
4.2.3 Which to use?
In practice, I tend to use 1:50,000 OS maps for most simple coastal navigation. I’ll think about using a chart instead when:
- I’ll be leaving the coastline - e.g. paddling between islands, or especially if I’m making an open crossing - tidal information, and marking of buoys becomes useful
- When the available charts for the area contain a lot of information useful to sea kayakers - mostly tidal stream information, or buoys useful for navigation
- When charts are available at useful scales (e.g. 1:50,000 or larger)
- When information on drying heights is useful - i.e. in areas like estuaries or shallow reefs where the area I want to paddle sometimes becomes dry land
- When I don’t need fine detail for navigating along the coastline.
In general, it’s possible to use either OS maps or charts for most purposes, especially if you mark up your OS map with tidal information and the odd useful buoy.
The one occasion when I will always use a chart is when navigating through areas with lots of other boats and large ships (e.g. Portsmouth Harbor, much of The Solent, Firth of Forth). In these places, it’s critical to know where the shipping lanes are and what landmarks harbormasters are referring to over the VHF. Buoys are often numerous and become essential for navigation if you’re doing anything other than hugging a shoreline.
In summary, 1:50,000 ‘Landranger’ OS maps are a great choice for most purposes, and will be totally adequate for sea kayakers undertaking simple coastal journeys away from busy ports.
4.2.4 Obtaining maps and charts
OS maps are widely available from bookshops and online sellers. The 1:50,000 ‘Landranger’ maps are normally adequate for sea kayaking. The 1:25,000 ‘Explorer’ series has more detail, but it’s only useful if you want to navigate with a level of precision that isn’t normally required. Ebay is a good source of second-hand OS maps.
There are some online sources for OS Maps:
Bing maps has an Ordnance Survey mapping option, with both 1:50,000 and 1:25,000 maps if you zoom in. The site has a print button, although the size and quality of the prints isn’t very useful.
Some other sites display OS maps using the OS maps API (e.g. The Hug). The terms of use linked on the map do not permit printing the maps out.
OS Maps is a subscription service that allows you to print OS maps at decent size and quality.
Charts are somewhat more difficult to get hold of. In the UK, charts were traditionally produced by the UK Hydrographic office (UKHO) under the ‘Admiralty’ brand. Whilst the UKHO still produces paper charts, it has announced that it will stop doing so by the end of 2026. Most UKHO charts are rather large, designed for use on large ships. However, the UKHO publishes leisure folios of charts for small craft users which are good value if you want coverage of a large area and contain charts that are a more sensible size for the average coffee table.
VisitMyHarbour is a website intended for sailors which much useful information (e.g. tide tables, tidal stream atlases) for free. For a very modest one-time charge, you can access the entire set of UKHO charts for the UK.
The other major chart producer for the UK is Imray. When the UKHO announced their intention to discontinue paper charts, Imray said that they would continue to produce them for the foreseeable future. However, they decided against this in 2024 and will stop selling paper charts around the end of 2025. Imray does offer a phone and tablet app, but I’ve not found an online source for their charts.
For yachting, it’s considered essential to have fully up-to-date charts - sailors get particularly worried about newly discovered shallow rocks. Whilst things do change on charts, it’s far less critical for sea kayakers to have the most recent versions. This means we can take advantage of yachties selling their old charts secondhand. Ebay is a good source for UKHO and Imray charts.
Digital charts can be viewes on the Navionics app. Whilst the format is a little less familiar, the detail is impressive, especially if you’re interested in depth information.
4.2.5 Other sources of maps
Maps can also be found:
In guidebooks - whilst these aren’t normally good enough to navigate with, they often contain useful additional information (e.g. tidal streams, get ins…) and can be useful for planning discussions
Google - google maps isn’t great for navigation but can be superb for finding get-ins and scoping them out using Streetview.
The Paddle UK Go Paddling website carries a lot of information on places to go paddling around the UK, including the annotated ‘Paddlepoints’ map.
4.3 Coastal pilotage - handrailing
Pilotage is the art of finding your way around within sight of land, using visual references. It is considered distinct from ‘Navigation’ (with a capital N!), which often refers to finding ones way away from land, or without good visual references. The ‘formal navigation for short crossings’ section discussed a simple example – the bearing that we calculated could, in theory, be followed even in thick fog with no visual references.
Most sea kayak navigation is really pilotage – making the most of the things that we can see.
The simplest approach to coastal navigation is simply to follow a linear feature (like a coastline) and know how far along this we are by the things that we have passed.
What landmarks would we expect to see on a paddle from Portloo to Old Town?
Paddling out of Portloo, turn left around a rocky area (island at HW). Pass a small beach, a rocky promontory, a second beach and a lifeboat station. Paddle past the town beach and round the pier. Pass a small island, turning left. Pass a point and turn left again. Left again at a point with a beacon offshore. Sharp left inside some islands into a beach with buildings behind. Back out of this bay, past an indent (island) to a major headland (lighthouse). Round the headland, offshore island, smaller headland and into Old town bay (look for main road and the town).
Of course, a similar approach might be used by a group paddling inland following a river.
4.3.1 Compass use for coastal pilotage*
Many kayakers see their steering compass mainly as a tool to be used for open crossings. In fact, they can be very useful when following coastlines. A kayak following the coast normally points in the direction of the coastline, so glancing at the compass tells you which direction the coastline is running in. Keeping an eye on this is a good habit to get into:
You can easily spot places where the coastline changes direction - at a corner or headland.
If the coastline follows a gradual curve, you can estimate how far around the curve you are.
4.4 Distance, speed and time
It is useful and good practice to estimate the time that should be taken to get to the next waypoint on our route. This enables estimation of how far has been paddled (e.g. ‘we’re half way there’) and acts as a check on the speed of the group. Slow progress could indicate tired paddlers or an unexpected tidal stream in the opposite direction.
4.4.1 The units of the sea*
Distances on the sea are measured in nautical miles. One nautical mile is defined as one minute of latitude. This means that, as well as the chart scale, the latitude scale on the chart can be used measure distance. For example, on the example chart below, the distance from the Old Wreck buoy to Spencers Ledge Buoy is about 0.7 nautical miles.
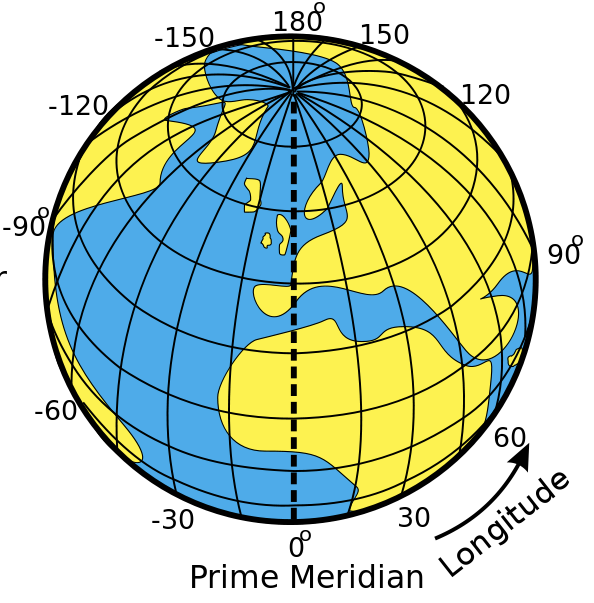
Never use the longitude scale to measure distance. A glance at a diagram showing lines of longitude shows that they converge at the poles. So a minute of longitude varies from about 1,855 m at the equator to zero at the poles. This makes the longitude scale useless for measuring distance.
How far is it from the Old Wreck Buoy to Jeffrey Rock? I measure the distance on my screen with a ruler as 42 mm - your measurement may differ, by the important thing is that this is about 4 and a half ticks up the latitude (vertical) scale on the map. 10 ticks up this scale is 1 minute of latitude, or 1 nautical mile. So, the distance is 4.5/10 = 0.45 nautical miles.
One nautical mile is approximately two kilometers and is very close to one statute mile. Kilometers are a more natural unit to use on OS maps with 1 km squares, but it helps to think of 2 squares as a nautical mile.
A boat that moves 1 nautical mile in one hour is said to have a speed of 1 knot. This would be rather slow. An inexperienced group of paddlers might expect to move at 2 knots, whilst a small experienced group might cruise at 3 knots. A fast and fit paddler might be able to cruise at 4 knots and sprint at 5 knots for a short period.
4.4.2 Distance, speed and time calculations
If we know how far we’re going and how fast we’re paddling, we can calculate how long it will take using Time=distance/speed.
For example, if we want to paddle 6 kilometers at 2 kilometers per hour, it will take 6/2=3 hours. If we want to paddle 12 nautical miles at 3 knots (i.e. 3 nautical miles per hour), it will take 12/3= 4 hours.
If we know the distance between two points on our route and how long it took to get between them, we can calculate our speed: Speed=distance/time.
For example, if it took us half an hour to paddle 1 nautical mile, our speed is 1/0.5=2 knots.
If speed is known, time taken in minutes can be estimated by multiplying the distance in nautical miles by:
- 30 for 2 knots speed
- 20 for 3 knots speed
- 15 for 4 knots speed
As a guide:
New paddlers in general purpose boats / SUPs / canoes might travel at 2-3 kilometers per hour and want to cover 6-10 kilometers (3-5 miles) of flat water in a day
Regular paddlers in general purpose boats / SUPs / canoes might paddle at 2 knots / 4 kilometers per hour and want to cover 8-15 km (4-8 miles) in a day
A less experienced group of sea kayakers might paddle at around 2 knots / 4 kilometers per hour and want to cover 4-6 miles in a day
A more experienced group might paddle at 3 knots and cover 10-12 miles (20 if they’re fit and keen)
How long will it take to paddle from Portloo to Old Town at 2 knots?
The distance is a little tricky to measure around the wiggly coastline. It is around 6 grid squares = 6 km. 6 km is approximately 3 nautical miles.
Time taken = distance / speed = 3 / 2 = 1.5 hours = 90 minutes
Or, using the numbers given above, time taken = 3 miles X 30 = 90 minutes
4.4.3 Dead reckoning*
If we know how fast we’re paddling, and how long we’ve been paddling since we passed a particular point, we can calculate how far from that point we are. If we also know what direction we’re paddling in (e.g. by following the coast, or by paddling on a bearing), then we can estimate where we are. This process is known as ‘dead reckoning’. It should be done with caution, as it ignores the effect of wind and taking tide into account can be tricky.
4.5 Navigation tricks
Here’s a few simple principles to make navigation a little easier. They’re handy whenever you’re on the water, but they become invaluable if you’re trying to find your way in fog or at night.
4.5.1 Short legs
Keep each hop between identifiable features short - avoid long sections during which you can’t check your navigation.
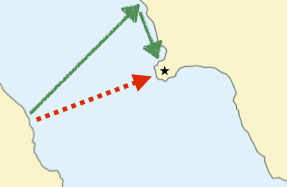
4.5.2 Aiming off
If you take a bearing towards an object (e.g. a place on distant shoreline), it’s very unlikely that you’ll end up exactly where you planned. When you arrive at the shore and don’t immediately find the thing you’re looking for, it’s not clear what to do next - do you turn left or right? To avoid this problem, deliberately aim to one side of the feature - that way you’ll know which way to turn.
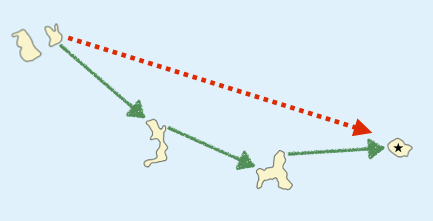
4.5.3 Attack points
Heading a significant distance towards a small feature isn’t likely to be successful. A better plan is to locate an easy to find feature nearby, then head from here towards your smaller feature. If you don’t succeed on the first go, you can return to your large, prominent feature and try again.
Map diagrams based on Holmes, Ian. (2017). Mean High Water Springs Polygon, [Dataset]. University of Edinburgh. https://doi.org/10.7488/ds/1969, public sector information licensed under the Open Government Licence v3.0
4.6 The compass and bearings
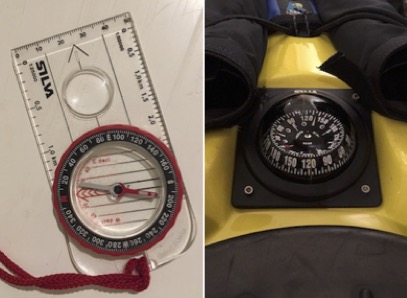
Compasses are useful as they allow us to set direction on the water relative to (magnetic) north. Two types are commonly used on a sea kayak:
- A hiking (baseplate) compass is used for measuring bearings on charts and taking bearings of objects from the cockpit.
- A steering compass is mounted to the front of a sea kayak. It is used to determine the direction that the boat is pointing.
The simplest way to use a compass is to align a map by aligning the north-going lines on the map with the compass needle (ensuring the red end of the needle points towards the top of the map). Setting a map in this way often helps with orientation.
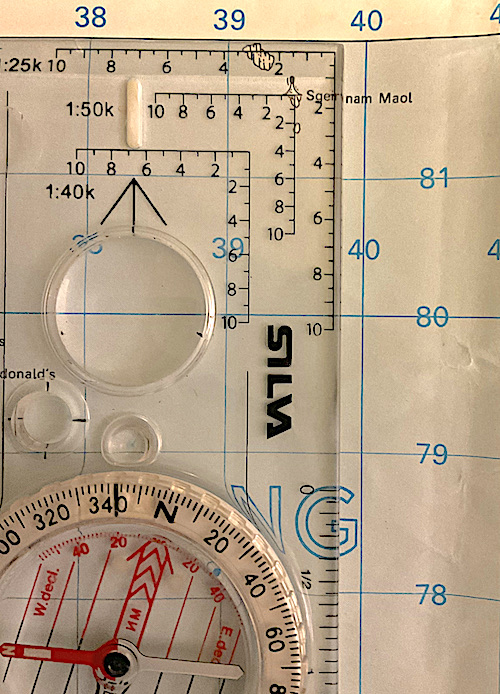
One use of a compass is simply as a protractor to measure bearings on a chart. To do this:
- Align the side of the compass along the bearing that you wish to measure. Check that the arrow on the compass base plate points along the bearing direction.
- Rotate the bezel of the compass to align the lines inside the bezel with north-pointing grid lines on the map
- Read off the bearing at the fiducial mark (black line) at the edge of the bezel scale.
What is the bearing of Gull point from Wras island?
Place one edge of the compass along the bearing to be measured – here the lower edge of the compass is aligned between Wras island and Gull Pt.
Check that the arrow on the base plate points in the right direction – here we are measuring a bearing from Wras to Gull Pt., so the arrow is pointing in the correct direction – towards Gull Pt:
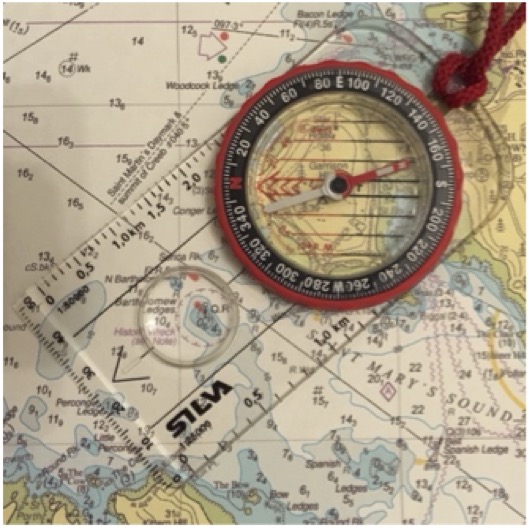
Twist the Bezel until the red lines inside it align with the north-going grid lines on the map.
Read off the bearing from the mark on the edge of the bezel. Here it is 230˚
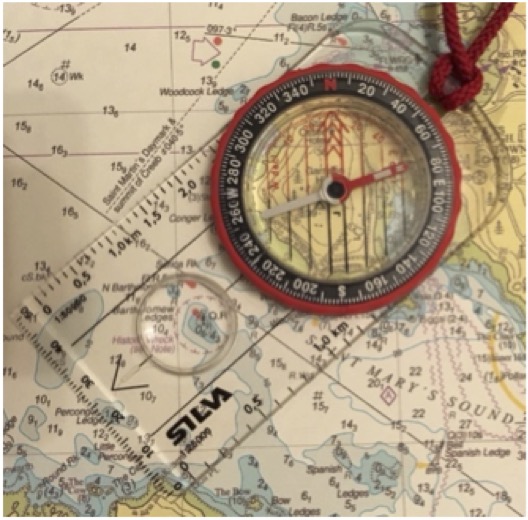
Chart © Crown Copyright and/or database rights. Reproduced by permission of the Controller of Her Majesty’s Stationery Office and the UK Hydrographic Office (www.GOV.uk/UKHO)
Grid lines on maps and charts do not point exactly towards the magnetic north that a compass needle aligns with. However, the difference is currently very small in the UK - so if you’re based in the UK and new to compass use, you might want to ignore the info below on magnetic variation.
Magnetic variation Unfortunately, the grid lines on maps and charts do not point towards the magnetic north that a compass needle aligns with. This is because the location of the magnetic north pole is not in the same position as the north pole used as a datum for grid systems. The difference between the map’s grid north and the magnetic north that the compass points to is called magnetic variation. It varies from place to place and from year to year. Magnetic variation is shown on maps and charts.
Magnetic variation in the UK is very small – generally 3˚ or less. This is a greater than the level of accuracy that can really be achieved on a kayak deck. As such, corrections for variations can be ignored for many practical purposes.
To convert from bearings taken from the map to magnetic bearings, westerly variation (typical in UK) is added to the bearing. A subtraction is required to go from magnetic bearings to true (map) bearings. However, it’s worth noting that some areas of the UK now have easterly variation on OS maps.
What is the bearing of Gull point from Wras island with reference to magnetic north?
We measured the bearing as 230˚T (T=with reference to true north).
On the chart we find a compass rose that indicates magnetic north. It reads: 3˚00’W 2015 (9’E):
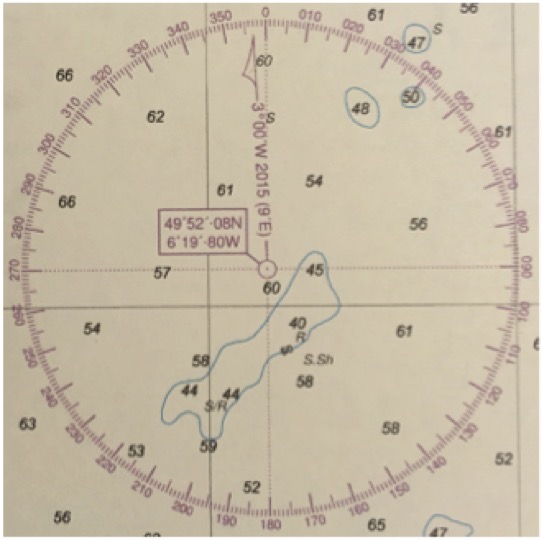
This means that magnetic north was 3˚W of grid north in 2015, and is moving east (i.e. variation is decreasing) by 9’ a year.
It is now 2017, so variation will be 2˚42’W. Let’s take it as 3˚ at a reasonable level of accuracy.
Being westerly variation, this must be added to the bearing to give 233˚MN (magnetic).
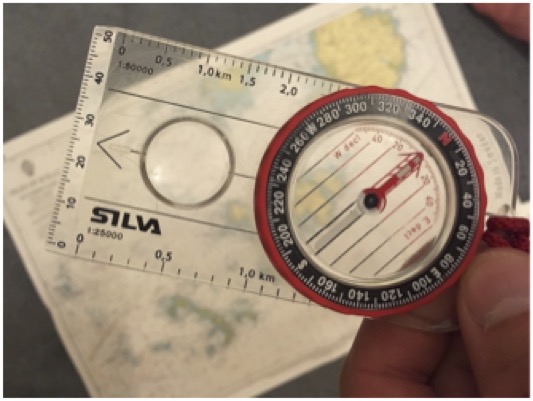
Once a compass has been set to a bearing as described above it can be picked up off the map and rotated until the red north needle aligns with the red arrow within the bezel.
The arrow on the compass base plate now points along the bearing that we have set the compass bezel to.
The process above can be reversed to transfer a bearing measured across the water to a chart. For example, if you want to know which lighthouse you’re looking at:
- Point the compass base plate arrow at the lighthouse
- Twist the bezel until the red part of the needle aligns with the red arrow
- Place the compass on the map, with the red lines within the bezel aligned with the north-going grid lines
- Place the edge of the compass on your current position
- The lighthouse should appear on the chart somewhere along the same edge of the compass.
4.7 Specifying position
It is useful to be able to specify a position exactly on a map or chart. Indeed, this could be of critical importance when informing the coastguard of your whereabouts in an emergency.
4.7.1 Grid references
Many people will be aware of the OS national grid. All OS maps are overlaid with blue grid lines which divide the map into 1 km squares. Numbers along the side of the map allow each square to be referenced.
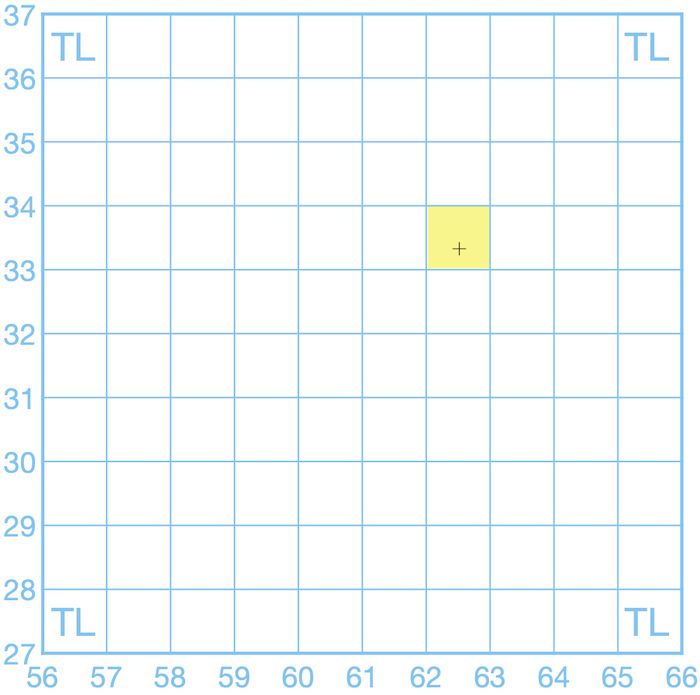
To reference a specific square on the grid we use the numbers to the left of and below the square. For example, to reference the square on the grid above highlighted in yellow, we’d use the number 62 along the bottom of the map (the ‘easting’) and 33 along the side (the ‘northing’). OS grid references are always given with the number along the bottom of the map (easting) first (some people use the phrase ‘bottoms up’ to remember this). So the grid reference for the square is ‘62 33’.
The reference numbers on OS maps only go from 00 to 99. This is a problem as OS maps have to cover the whole country, which is larger than 100 km x 100 km! To solve this problem the country is divided up into 100 km squares, each referenced by 2 letters. You’ll find these letters at the corners of OS maps, or at the edges of the squares, when these appear on a map. Our grid above is entirely in the ‘TL’ 100 km square, so we can provide a gird reference for our square of ‘TL 62 33’. In practice, the letters can be omitted if it’s clear roughly where the location is.
TL 62 33 is called a 4-figure grid reference for fairly obvious reasons. 4 figure grid references refer to a 1 km square, which is quite a large area. We often want to specify location more accurately than that. Because of this, sea kayakers will normally use 6-figure grid references, which specify a 100m x 100m square.
You’ll notice that there aren’t any grid lines spaced at 100 m intervals - they’d make the map look very cluttered. We need to estimate location within the grid square instead. For example, let’s create a 6-figure gird reference for the cross on the grid above. Looking first at the eastings along the bottom of the map, the cross appears about halfway across the grid square. Thinking of 10 imaginary divisions across the grid square, the cross would be on the 5th division, so we append the number ‘5’ to our original easting number to give ‘625’. Looking up the side of the map, we estimate that the cross is about three tenths of the way up the grid square, giving a northing of 333. Our complete 6-figure grid reference is ‘TL 625 333’.
Let’s look at an example on a real map.
What is the grid reference of the Peninnis Head lighthouse?
Notice that we can’t see the edge of the map here. However, you’ll notice that grid numbers are helpfully printed across the map to make giving grid references easier.
- Two letters that identify the 100 km square – in this case ‘SV’. This would be given on the corners of the map sheet (not shown on the map extract above).
- The ‘easting’ – the ‘horizontal’ coordinate. We use the scale on the edge of the map, which is repeated for convenience across the sheet. The first two letters identify the grid square – in this case ‘91’. For greater precision, we can add a third number to indicate how many tenths across the square the location is. In this case the lighthouse is 1/10 of the way across the square, so the third number is ‘1’ to give a complete easting of ‘911’
- The ‘northing’ – the ‘vertical’ coordinate. Exactly the same as for the easting, but up the map. In this case, ‘093’. Note that we keep the leading zero here to make it clear that this is a 6 figure gird reference, and we aren’t referring to square 93.
The complete grid reference is thus ‘SV 911 093’.
We’d use the phonetic alphabet to say this over VHF: “Sierra Victor nine-one-one zero-nine-three”.
Giving 6-figure grid references is somewhat approximate, but for most purposes estimating the final numbers for eastings and northings by eye is good enough. A tool called a ‘romer’ - a card with graduations matched to the map scale - can be used to improve accuracy. Many hiking compasses feature romer scales at their corners, so if you’re carrying a compass, it’s likely that you can use one if you want to be super-accurate.
There’s no theoretical reason to stop at 6 figures. An 8-figure grid reference specifies position to the nearest 10 meters. It’s hard to read an 8-figure grid reference from a map (although using a romer and a 1:25,000 makes it feasible). However, 8-figure (or even 10-figure) grid references are commonly given by GPS units.
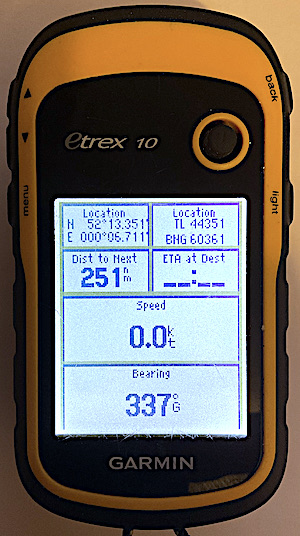
If you end up faced with an abnormally long OS grid reference, simply ignore anything after the first 3 figures of the northing and easting to give yourself an understandable 6-figure gird reference. For example, the GPS unit in the photo above shows ‘TL 44351 60361’. I’ll read off TL 443 603, which is a 6-figure grid reference that I can reference to a map easily.
4.7.2 Latitude and longitude*
Nautical charts are designed for use by vessels that might voyage across much of the globe. The OS grid only covers the British Isles, so a more universal system is needed to give positions anywhere in the world. Positions on nautical charts are given as latitude and longitude. It will help to understand how this system works on a global scale before using it to define a position.
The earth can be conceived of as a sphere, rotating about the poles, with a line called the equator halfway between the poles. Latitude and longitude are angles measured from the center of the earth. The equator is defined as the line of zero latitude. The north pole is defined as latitude 90 degrees north and the south pole as latitude 90 degrees south. Lines of latitude run around the earth parallel to the equator and are defined by the angle between the line, the center of the earth and the equator.
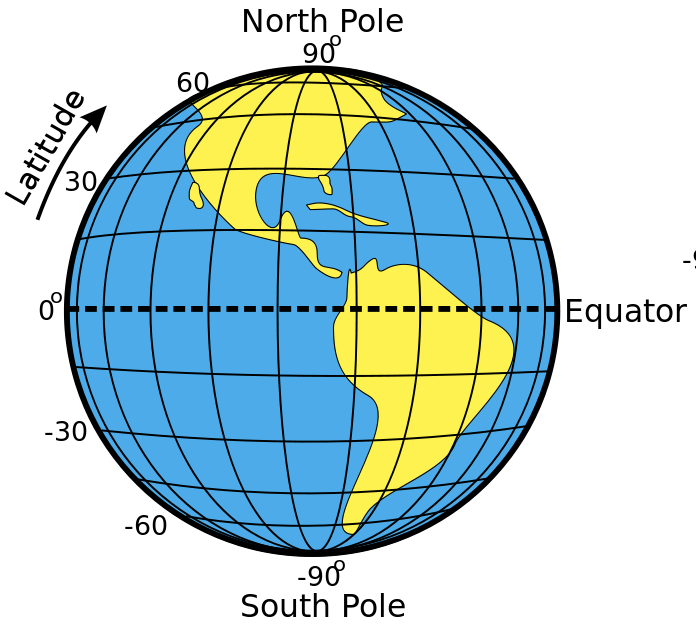
By contrast, lines of longitude run from the North Pole to the South Pole. There is no natural line of zero longitude, but by convention, Greenwich is defined as longitude zero. Points to the west of Greenwich have a westerly longitude (e.g. 30˚W) and points the east have an easterly longitude (e.g. 10˚E). G
One degree of latitude or longitude is quite a large distance, so subdivisions are required to specify position precisely. Each degree is divided into 60 minutes. A minute is denoted by a single quote mark: 1’. So, longitude 10˚ 30’ W is halfway between 10˚W and 11˚W.
Each minute can be subdivided again into 60 seconds (60”), but in practice, decimal minutes are more commonly used. So a longitude might be given as 4˚39.6’W.
Again, an example is the easiest way to explain how latitude and longitude are used in practice.
What is the position of the Old Wreck buoy?
Latitude will be shown vertically up the chart, along scales on the sides and on some grid lines. We can see that latitude 49˚54’N is shown in full, and 49˚55’N is indicated by a 55’ mark. Between these, there are 10 divisions, so each must be 0.1 of a minute. The latitude of the buoy is 49˚54.2’N
Longitude is shown similarly horizontally across the charts. Note that because this chart is of an area west of Greenwich, the numbers increase from right to left. We can see 6˚24’W marked in full, with 23’ and 22’ also shown. The longitude of the buoy is 6˚22.8’W.
The position can be specified as 49˚54.2’N 06˚22.8’W (we’ve included a zero ahead of the 6˚ just to make it clear there’s not a number missing).
We’d say this (e.g. over VHF) as “four-nine degrees, five four decimal 2 minutes north, zero-six degrees, two two decimal eight minutes west”.
Note that, in contrast to grid references, the northerly coordinate is given first. Directions (north, south, east or west) are always included.
Chart © Crown Copyright and/or database rights. NOT FOR NAVIGATION. Reproduced by permission of the Controller of Her Majesty’s Stationery Office and the UK Hydrographic Office (www.GOV.uk/UKHO)
4.8 Navigational marks*
To assist the navigation of ships, navigational marks such as lighthouses, buoys and beacons are placed around the coastline. Because kayaks can operate in very shallow water, these aren’t useful to us in the way that they were intended for large vessels. However, they do provide useful landmarks if you’re carrying the nautical chart. A basic understanding of what the main buoys mean will help you understand where larger vessels are likely to go and thus help you avoid them.
Lateral marks are used to mark the edges of shipping channels – for example into and out of a harbor. As a big ship enters a harbor, red can-shaped port-hand buoys will be on the left, whilst green conical starboard-hand buoys will be on the right.
A mnemonic to remember this is “no more cans of red port left”.
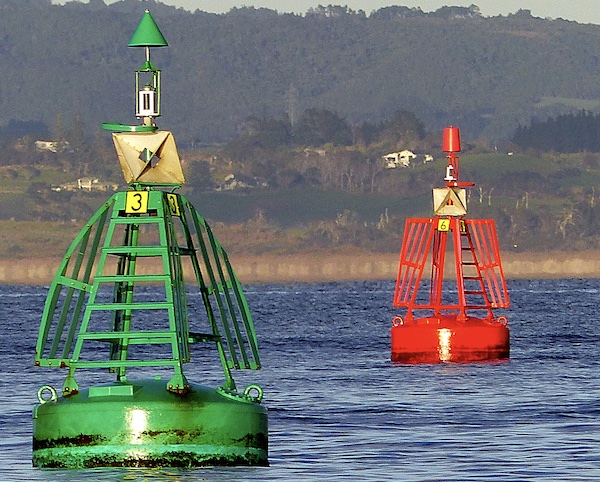
This is the system known as ‘IALA A’, used in the UK and many other parts of the world. Some areas, notably the US, use ‘IALA B’, in which the colors of the buoys, but not the shapes, are reversed.
Cardinal marks indicate the presence of hazards – normally shallows that big vessels would rather avoid. A cardinal mark indicates the direction from the mark in which safe water can be found. For example, safe deep water will be found to the north of a north cardinal buoy, with the hazard lying to the south. The marks are differentiated by the orientation of two cones at the top as well as the sequence of black and yellow colors on the buoy, as shown in the diagram.
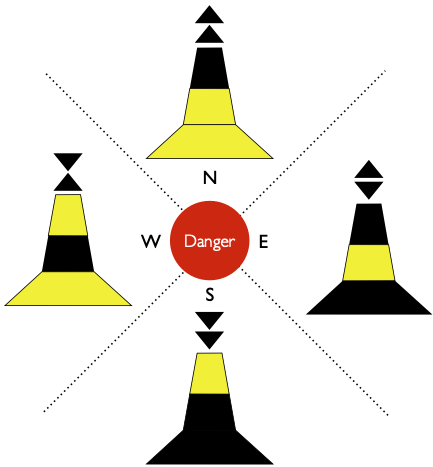
Because cardinal marks indicate shallow areas, they can sometimes be posts attached to the seabed rather than floating buoys.
The buoy in the image below is an west cardinal mark, indicating shallows to the east.

The chart extract below shows an example of how navigational marks might be positioned:
As sea kayakers, the hazards (e.g. shallows) indicated by lateral and cardinal buoys aren’t an issue for us. It’s often better to go the ‘wrong’ side to keep out the way of big vessels.
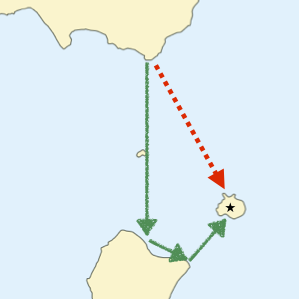
For example, imagine that we’re crossing Saint Mary’s Sound (see chart above) from Kittern Rock to the western corner of Garrison Hill. We’ll use bearings and transits to keep on course, but the red post and buoy that mark the Bartholomew ledges will be useful landmarks along our way.
As we get close to the post and buoy, we notice the ‘Scillonian’ - a 68 meter long ferry - coming around the headland of Garrison Hill. It looks like it’ll head to our right.
However, consulting the chart, we notice that the main shipping channel passes to the north-east of the Bartholomew ledges buoy - we can see the course marked with a line on the chart, and we know that the channel must go between the red Bartholomew ledges buoy and the green ‘Woolpack’ mark.
It is possible, but unlikely, that the ferry will go the south-west of the Bartholomew ledges. However, it certainly won’t go through the middle of the very shallow ledges marked by the red buoy and post. The safest place to be is close to these lateral marks - ideally between the N Bartholomew buoy and the post.
So, we paddle the short distance across to the N Bartholomew buoy and pause our crossing, taking advantage of a slight eddy forming over the shallows so we don’t need to paddle too hard into the tidal stream to hold our position. We watch the Scillonian turn. For a scary moment it points directly towards us, but it keeps turning, and soon passes to the east of us.
Chart © Crown Copyright and/or database rights. NOT FOR NAVIGATION. Reproduced by permission of the Controller of Her Majesty’s Stationery Office and the UK Hydrographic Office (www.GOV.uk/UKHO)
4.9 Formal navigation for short crossings
We now know how to determine which way a tidal stream will be running and how to estimate how quickly it will be running. Together with the pilotage techniques covered elsewhere, this is generally sufficient knowledge to kayak in tidal waters. However, if more ambitious crossings are being contemplated, it is helpful to be able to carry out formal navigation to determine what course to steer and how long the crossing will take.
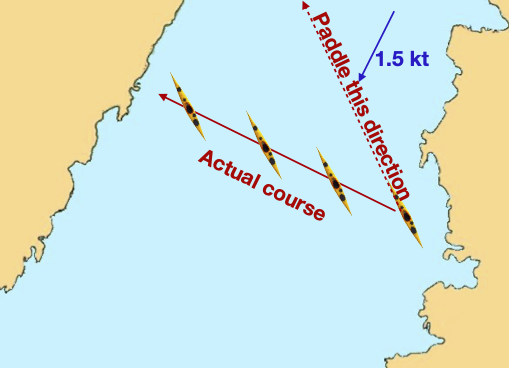
Imagine a paddler capable of 3 knots paddling speed attempts to paddle across a 1-mile wide tidal strait running at 1.5 knots to the south. If the paddler takes a bearing to a point on the far side and paddles on this bearing, they will not get to where they expect. During the 20-minute crossing, they will drift 0.5 miles southward.
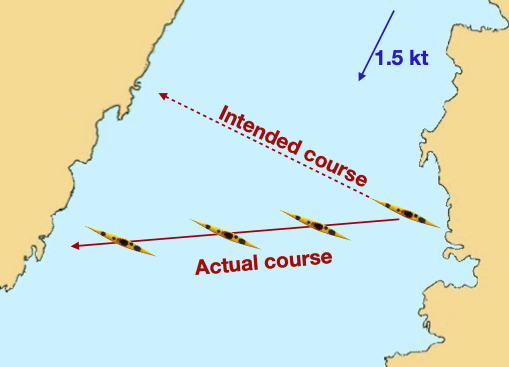
The solution is to angle the boat up tide enough to cancel out the southerly drift. It’s the same principle as a ferry glide on a river, just over a longer distance.
It’s clear that we will need to alter the course that we steer in tidal waters. The question is how much, and how long will a crossing take given the influence of the tide?
For the mathematically minded, this is simply a problem in vector addition to balance the effects of the tide with the paddling speed. For the rest of us, here’s a simple explanation followed by an example.
Let’s begin by considering a simpler problem. If we’re trying to paddle directly against the tide up the strait, what will happen? We’re paddling at 3 knots against a 1.5 knot tide. Most people will immediately work out that we’ll travel at 1.5 knots up tide and cover 1.5 nautical miles in an hour. But let’s take a more careful approach.
The trick we’re going to use is to avoid the complexity of the tidal flow and the paddling both happening at the same time, but instead pretending that they happen one after another. It’s as if we were playing a board game against the tide - the tide gets to make it’s move, then we get to make ours. So imagine that at 09:00, rather than paddle against the tide, we simply drift for an hour - let the tide make its move. We’d drift 1.5 knots down tide, as shown by the blue arrow in the diagram below:

We then make our ‘move’ and paddle up tide for an hour at 3 knots, as shown by the red arrow. We’d end up at the place indicated by the second boat at 10:00. In reality, of course, the paddling and the tidal flow happen at the same time, and we follow the green arrow, but assuming one thing happens at a time allows us to draw out what occurs carefully.
Let’s try this again when we’re paddling across the strait. Once again, if we do nothing for an hour, the tide will push us 1.5 nautical miles down the strait (blue arrow):
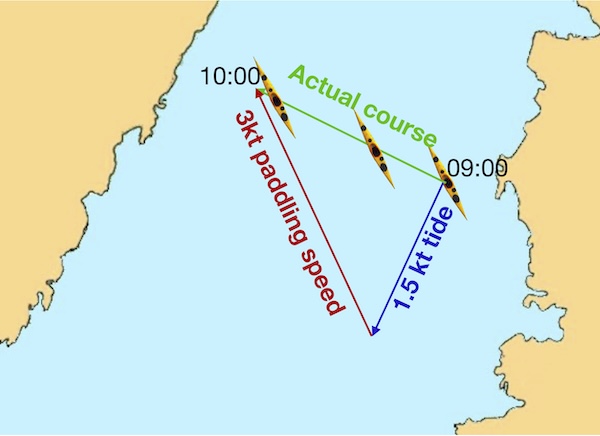
But this time we paddle at 3 knots not up the strait, but in a north-westerly direction (red arrow), ending up at the position of the second boat drawn at 10:00. And of course, in reality, we’ve carried out a ferry-glide along the green arrow.
In this example, we’ve probably ended up where we want to be by chance. But how might we use this approach to decide what direction to paddle in?
Let’s draw out the blue arrow to show what the tide does once more, and add a line to indicate what direction we actually want to travel in:

Now, imagining that the tide and our paddling occur one after the other, what are the options for our ‘move’ if we’re going to paddle at 3 knots and cover 3 nautical miles? We can choose to cover those 3 miles in any direction from our position at the end of the blue arrow:
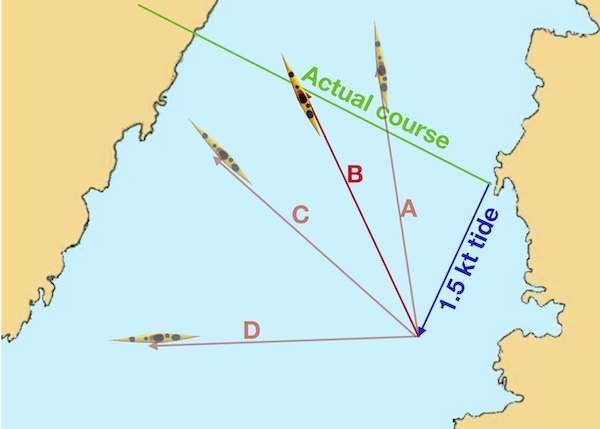
If we paddle west (D), we’ll end up way south of where we want to be. Paddling almost north (A) has us ending up too far north and up-tide. C is better, but still off our intended course. Clearly, direction B is ideal. All we’ve had to do is make sure the tip of the red arrow, which is 3 miles long to the chart scale, sits on the green line. Notice that the place we get to after an hour is still short of our destination on the far shore. That’s fine - as long as the tidal stream stays consistent, we can keep paddling in the same direction and we’ll arrive in a little over an hour.
The tips of all the red arrows that indicate our possible courses lie, of course, on a circle centered at the end of the blue arrow:
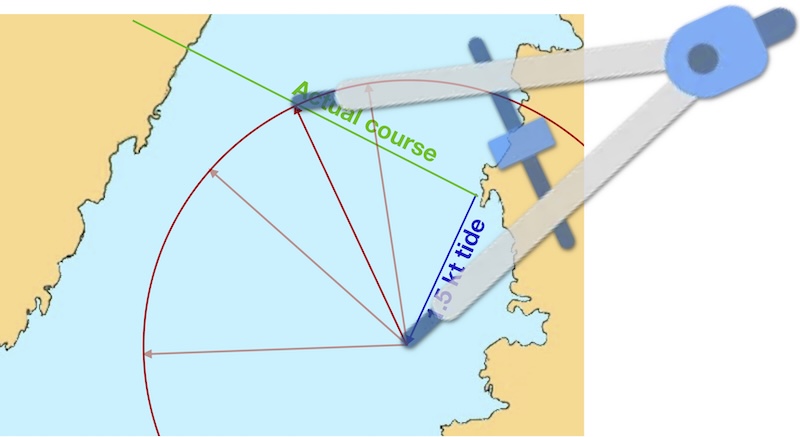
Where the circle crosses the green line is the point we want to draw our red paddling direction line to. So, we can use a pair of compasses set to 3 miles to find where this point is.
Let’s see how this works in a real example.
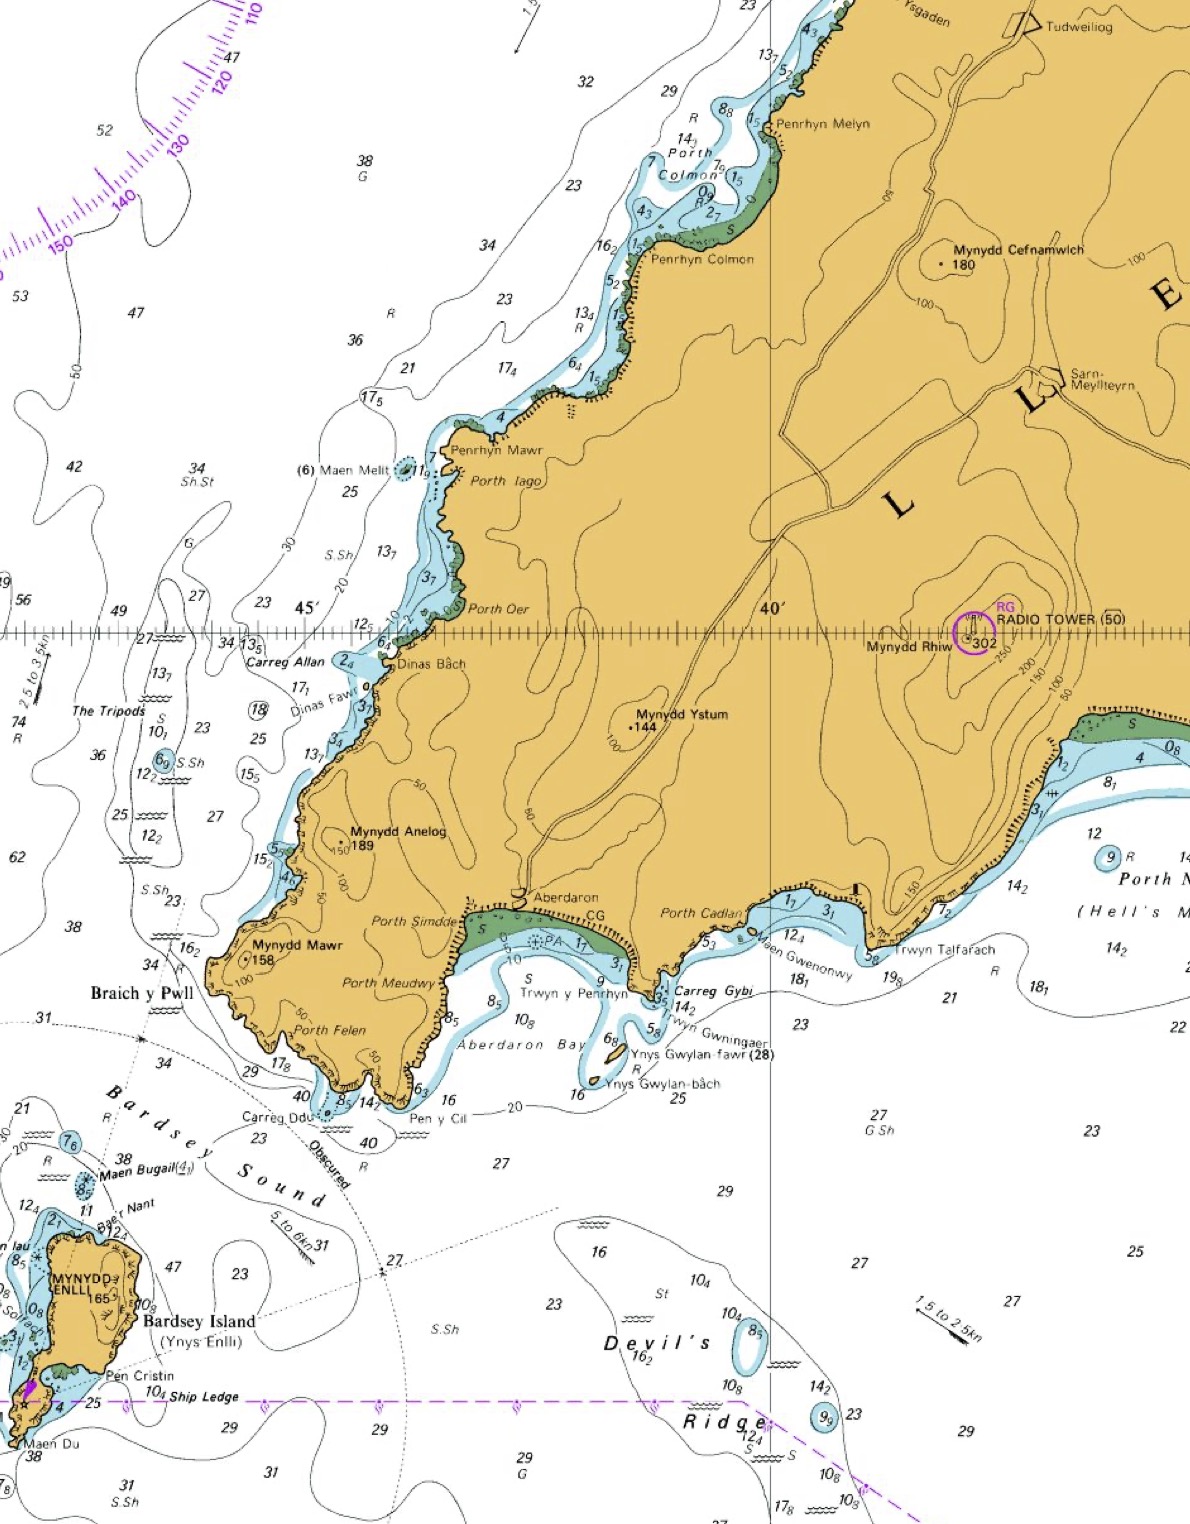
Estimate course to steer and time taken to cross Bardsey sound from Pen y Cil to the NE tip of Bardsey Island when a 2 knot tide is flowing NW. Your group is capable of paddling at 3 knots in still water.

First draw a line from start point to the destination and well beyond – the green line.
Then draw a line that represents the tidal flow in one hour. In this case, we are told the flow is 2 knots, so a 2-mile long line is needed. Recall that we can use the latitude scale to measure this. We assume that the tide flows in the direction indicated by the arrow on the chart. The blue line is 2 miles long and parallel to the arrow.
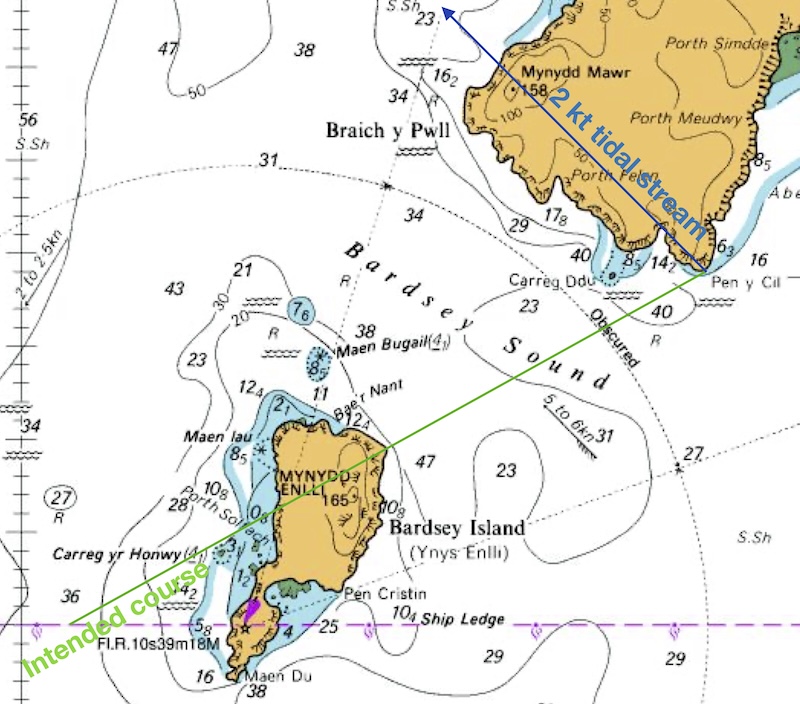
We then set our compass to the distance we intend to paddle in 1 hour - i.e. 3 nautical miles. We draw a circle (or part of a circle), centered on the end of the blue tidal stream arrow to indicate all the places that we could end up at the end of the hour:

There’s a place where this circle of possibilities crosses our intended course line - indicated with a yellow circle. This is where we should draw our 3 mile paddling arrow to:

The red line on the chart now indicates the direction that you should point the boat for a successful crossing. We can measure the angle of this line from north - it’s 200˚. This is the course to steer during the crossing. If we paddle from Pen y Cil at 200˚ at 3 knots, we expect to follow the green intended course line… and hence get to Bardsey successfully.
The distance along the green line from the blue line to the red line represents the distance that you would travel if you paddled across this tide for 1 hour – in this case 2.7 miles. It is clear here that it’s going to take less than one hour to get to Bardsey. The distance to Bardsey along the green line is 2 miles. So we expect the crossing to take 60 x 2/2.7 = 45 minutes.
The error often made in this process is drawing the paddling speed (red) line directly to the destination point. Instead, it must be of the correct length to represent 1 hour’s paddling distance and this will determine where it intersects the intended course (green) line.
The method shown here assumes that the tidal stream is constant through the period of the crossing. This is a reasonable assumption for crossings less than one hour. For longer crossings, we must consider the effect of tidal streams that very in strength and direction. These techniques are beyond the scope of this course.
Chart © Crown Copyright and/or database rights. NOT FOR NAVIGATION. Reproduced by permission of the Controller of Her Majesty’s Stationery Office and the UK Hydrographic Office (www.GOV.uk/UKHO)