6 Open water navigation
“Open water” is not a well-defined term - a novice group might feel quite exposed the first tie they leave the shore of a lake, whereas a very experienced sea kayaker might be considering long open-ocean journeys, like the ~64 km crossing to the isolated island of St. Kilda off the Outer Hebrides. For the purposes of their open water module, British Canoeing Awarding Body uses this definition:
A large expanse of open water that at some point has an element of commitment i.e., returning to shore will not necessarily be straightforward, easy or a quick process
This section focuses on navigation techniques for paddling further from land. Clearly, we’ll need some new approaches to work out where we are when away from the landmarks of the shore. For longer crossings in tidal waters, we’ll need to do more work ahead of time to plan, given the limits of what we can achieve on the deck of a kayak. Much of this section focuses on the techniques used to plan crossings in tidal water that will take several hours to complete.
The chart work outlined in this section is a step more difficult than described elsewhere in these notes. I’ve tried to break it down step by step and explain it as simply as possibly. It might help to print off a copy of the example chart that I’ll provide and follow along with the example step by step.
The more complex techniques covered in this section fall outside of the remit of Paddle UK’s Sea Leader award. However, they are appropriate for those looking to become Advanced Sea Leaders.
6.1 General techniques for tidal and non-tidal waters
6.1.1 Dead reckoning
Whilst you could just head for your objective across an expanse of (non-tidal) open water and hope for the best, it’s better to do a bit of planning first. It’s good to know how long the crossing might take and which direction to paddle in. It’s also useful to estimate where you’ll be at times during the crossing in case you need to make any decisions if things change.
If we know our padding speed and the distance we need to cover, we can estimate the time taken as time=distance/speed. We’ll work in nautical miles and knots when planning crossings, remembering that 1 knot is one nautical mile per hour.
You are planning a multi-day trip in the Moray Firth on the east coast of Scotland. This is an area with relatively little tidal flow, and the trip is planned for neaps.
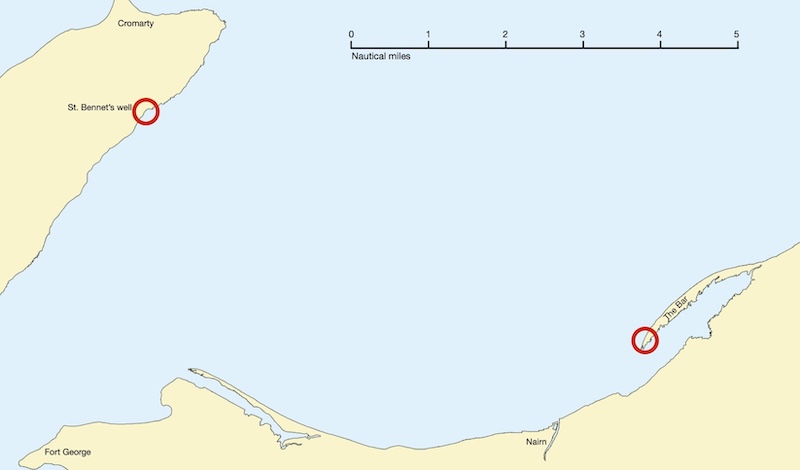
Plan a crossing from St. Bennet’s Well to a planned camp spot at the south-west end of The Bar
The coast east of Nairn that we are heading for is fairly low-lying, so The Bar will likely not be an obvious feature. We choose to aim off a little to the north, so that we can paddle south-west down the bar after we meet the shore to reach our camp spot.
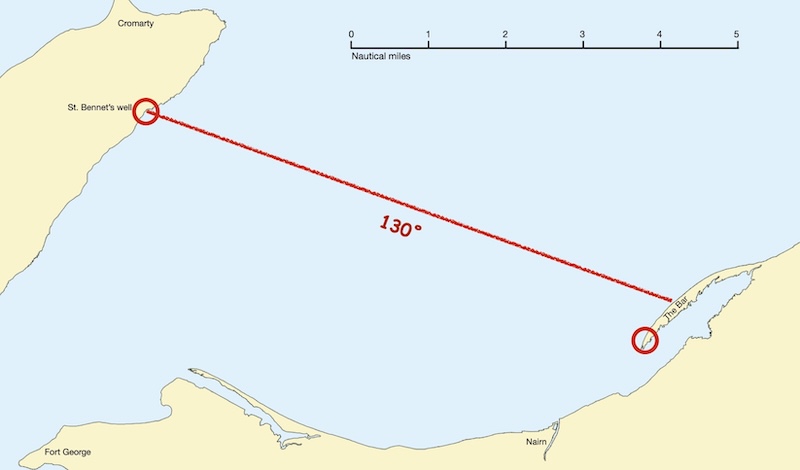
We draw a line on the chart along our planned route for the crossing. We measure the bearing off the map as 130˚ - actually, given that it doesn’t matter exactly how much we aim off, we choose to paddle on a bearing that is a round number to make remembering and following it a little easier.
We can now mark off the line of the crossing with tick marks every mile, using the chart’s scale and a pair of dividers:
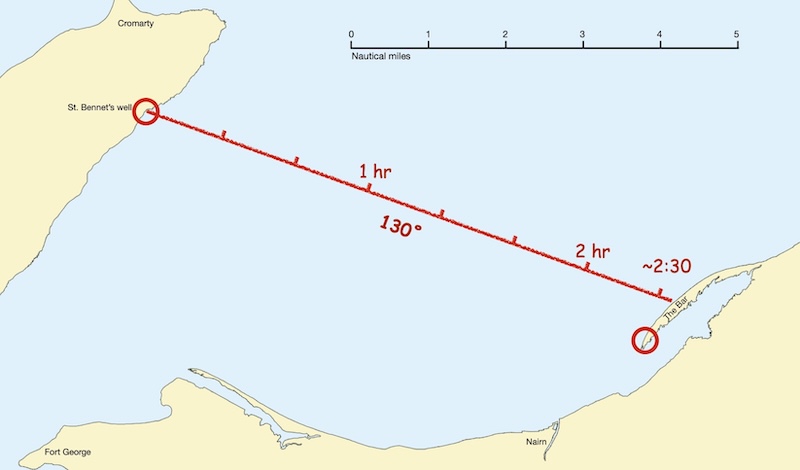 We know that our group travels at 3 knots (accounting for a short break every half hour), so we expect to cover 3 nautical miles during each hour of the crossing. We can annotate our map with the position that we expect to be after 1 hour (3 miles from our start point) and 2 hours (6 miles from our start point. Noting that it’s a little over 7 miles to the coastline, we estimate that it will take about 2 and a half hours to complete the crossing.
This information could be useful if we need to change our plans during the crossing. For example, if a problem occurred after 1 hour, we know that it will be quicker to turn back, or head to the coast on a bearing of 220˚ rather than continuing on our planned crossing.
6.1.2 Transits
Paddling across open water, if we can see where we are going, seems simple. However, as we saw previously, under the effects of tide and/or wind we may not end up where we expect.
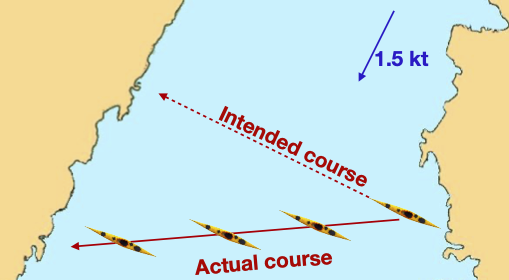
We need to find a way to correct for the influence of tide and wind.
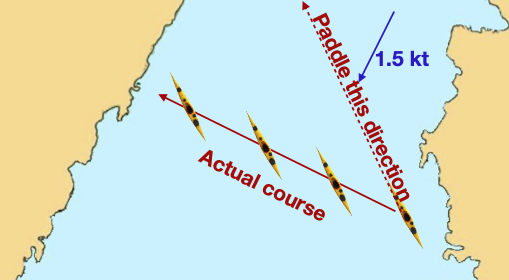
The easiest way to do this is to look for two objects at the planned destination, one behind another, that line up. If these objects stay aligned, the kayaker must be on track (B). If the kayaker is too far the the right (A), the further object will shift to the right. If the kayaker is too far the left (C), the distant object shifts to the left.
![]()
This technique is known as paddling on a transit (or, in the US a ‘range’).
Trearddur Bay, Anglesey has somewhat complex tidal flows. It is helpful to use a transit to cross it.
The transit on this occasion aligned the left edge of a house with the steepest part of Holyhead Mountain, as shown in A.
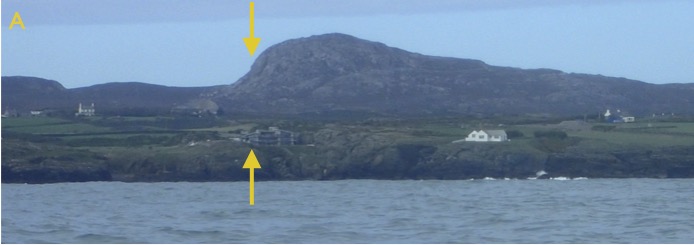
After a few minutes, the background transit (the mountain) was seen to have shifted right in relation to the foreground transit (the house) as in image B.
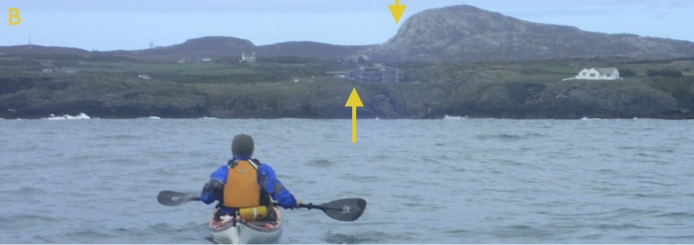
We had clearly been pushed to the right by tide and/or wind, and needed to point further to the left to maintain our course.
Where pilotage for yachts is especially tricky, you may find posts or other prominent markers, one behind the other. These create transits that mark safe lines through rocky channels. As long as the yachtsman keeps the white posts in line, they can expect to remain in deep water.
However, there’s no need to follow pre-placed transits. Any two features that line up where you want to go will do.
Often, the texture of the rock of a sea cliff provides a satisfactory front marker to use as a transit along with some feature on the horizon of the land behind.
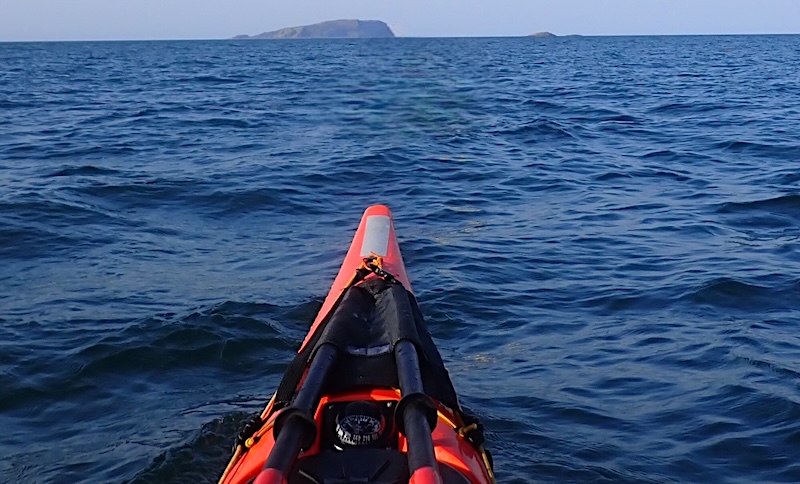
Paddling to offshore islands with no visible land behind presents a particular challenge. Often, insufficient detail can be picked out on the island to form a transit.
Some options might be used in this case:
- Use a reverse transit - i.e. one that is behind you rather than in front of you. Obviously, to make this work, you need to keep looking back over your shoulder
- Take a bearing towards the island and periodically check to see if this bearing remains constant. This tends to give less immediate feedback than the transit method
- Use the paddle shaft as a straight edge. Place one eye against the paddle shaft, so that you are looking along it. Point the paddle shaft towards the island - you should see the paddle shaft extending in a straight line from your eye towards the island. Without moving the paddle shaft, turn your head such that the other eye is looking along the paddle shaft in the opposite direction. If you’re on course, the shaft should point towards the point where you departed from the shore.
6.1.3 Following a bearing
If you have worked out a bearing to follow, it’s worth a quick thought as to how to actually follow it on the water. If you simply stare down at your compass or GPS, you’ll likely start to feel seasick pretty quickly, and it won’t be fun! Instead, set your boat to the bearing and look where your boat is pointing - ideally, find some object on the horizon - and paddle towards this. You’ll need to repeat this every few minutes if you anticipate tidal drift to check you’re remaining on the bearing.
When setting bearings, remember that you may want to ‘aim off’ (described in the Navigation section) - briefly, rather than aiming directly at a destination, we might aim slightly to the left or right so that we know which way to turn to find it once we hit the shore.
6.1.4 Fixes
Position fixing is the art of working out where you are on the sea. This doesn’t need to be complicated. Lots of methods exist. We’ll cover a few here, from the simple to the more complex:
- ‘Single point fix’ - simply noticing that you’re at an obvious landmark, like a buoy or a feature on the coastline.
- GPS systems can be used to fix position. There’s many different ways to use GPS. It’s often easier to program a (destination) point into the GPS to which it tells you range and bearing than to try and interpret coordinates.
- Three point fix - the classic method of position finding in open water. If a paddler can see two landmarks, they can take a bearing to each one. If they draw lines from each landmark along the bearing, they can fix their position where the lines cross. In practise three landmarks are commonly used to reduce mistakes and give a feeling for the likely error in the fix.
On a paddle from St.Agnes to Samson you wish to fix your position. You take bearings with your compass to the Old lighthouse on St.Agnes (171˚), the Star Castle Hotel (74˚) and the Spencers Ledge buoy (287˚). Where are you?
First, we note that this map has compass variation 3˚ W. We hence subtract 3˚ from each bearing. So, for the Lighthouse, we set our compass to 171-3=168˚. We place it on the map, align it to the north-going gridlines and align an edge with the lighthouse. We then draw a line along the edge of the compass. Repeat for the Hotel and the buoy:
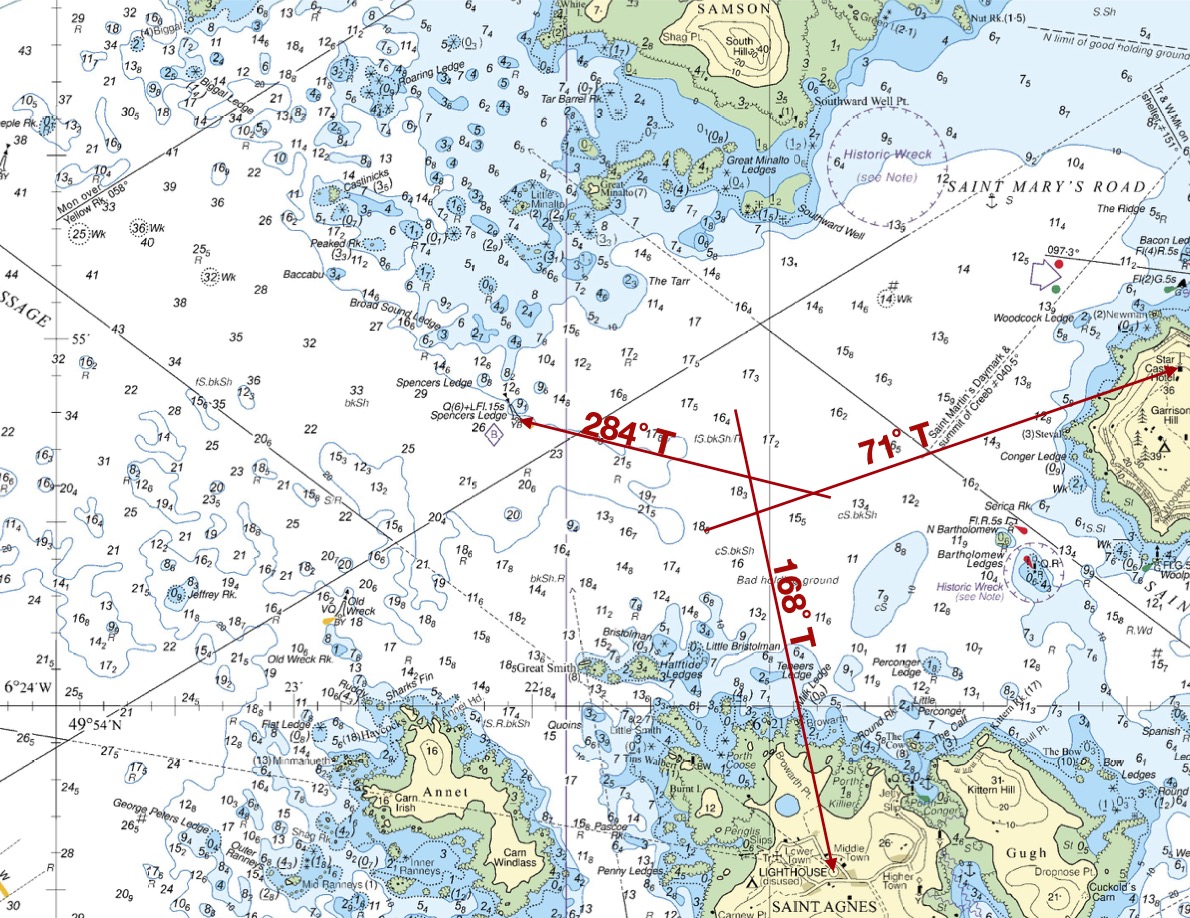
We are likely to be inside, or near, the triangle formed where the bearing lines cross. If we wish to give our position in latitude/longitude it would be:
49˚ 54.6’ N 6˚ 21.0 WIn practice, 3 point fixes are time consuming and fiddly to do on the deck of a kayak. Given that you often have a fairly good idea of what track you’re on, a single cross-bearing can often be a quick way to get a good estimate of position.
You are paddling from the western tip of Samson towards Saint Agnes, heading towards the lighthouse on a transit. You notice the Spencers Ledge buoy to your right, and take a quick bearing to it using your hand compass - 285˚. Where are you and how far do you have to paddle?
Obviously, you’re at the same place as in the example above - with about a nautical mile left to paddle before you reach Saint Agnes.
Whilst the bearing with the hand compass is likely approximate, given you took it quickly, you can be very confident that you’re on a straight line between the western tip of Samson and the lighthouse if you’ve been following a transit. If you also noticed that the Star Castle Hotel was to your left, in a direction roughly at right angles to your track, you could be fairly confident in your position.
Here’s another example
You are paddling from the small harbour on Bardsey Island to the headland of Trwyn Cilan. You are keeping on track in the strong tidal streams by using a transit between the headland and the hills in the distance behind it. You notice a radio mast on the hills to you left, and use your compass to determine that the bearing from you to the mast is 10˚. Where are you?
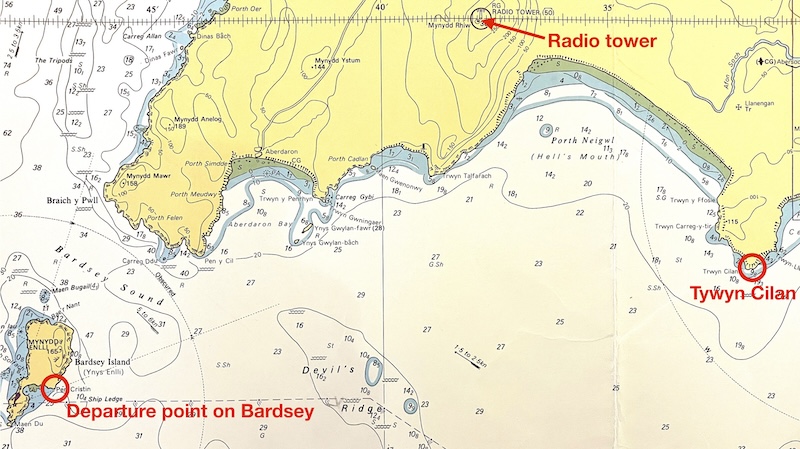
Given you’re following a transit from Bardsey to to Tywyn Cilan, you can be sure that you’re on a straight line between your start and finish points. You might have already sketched this line on your chart before leaving the island:
![]()
We can set our compass to 10 degrees and place it on the chart pointing at the radio mast
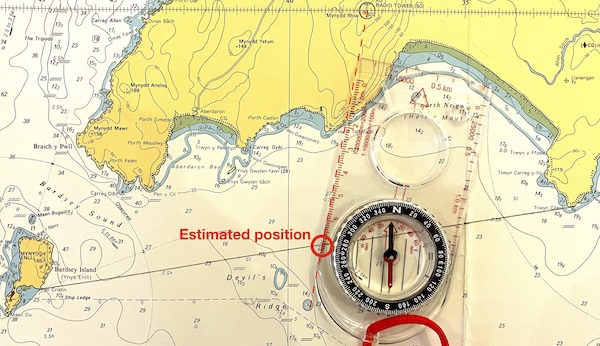
Note that this is intended as a quick and approximate fix - the compass baseplate isn’t long enough to reach the radio mast on the chart and the compass is only set approximately. However, it’s good enough to tell us that we’re about halfway across the crossing.
6.1.5 Distance off
Open crossings always seem to involve a lot of time staring at a destination that never seems to get any closer. It’s helpful to have some methods to estimate how far you are from the destination shoreline. As you’re likely fairly confident on your track (and can a bearing to the destination to confirm), knowing the distance still to paddle allows you to fix position. And debating how far you think it is with your companions might be a good way to break the tedium!
6.1.5.1 Resolvable detail method
In his excellent book Sea Kayak, Gordon Brown gives the following hints on how to judge how far you might be from a shoreline:
| Distance | Resolvable detail |
|---|---|
| 100 m | Possible to identify people by facial features |
| 200 m | Can see faces and clothing colours |
| 500 m | Can identify people by movement and shape. Small buoys and paddle blades are visible. |
| 1 km | People seen as dots. Can resolve individual windows on houses. Large buoys visible. |
| 1.5 km | Can see individual trees. Paddle flash, when a paddle catches the sun, can be seen. |
| 2 km | Can see individual houses (and perhaps large trees) and resolve cars from bigger vehicles. |
| 3 km | Limit of kayak-to-kayak visibility. Can separate trees for other vegetation. Paddle flash may still be visible. Flat beaches disappear. |
6.1.5.2 Subtended angle method
This method involves measuring the apparent angle of some distant object and comparing this to the width of the object on your map.
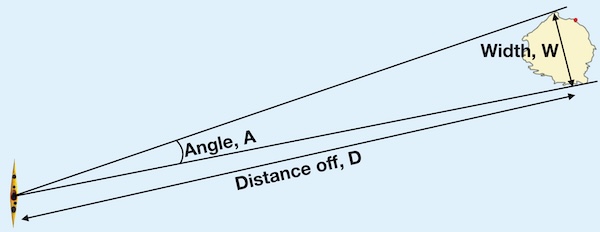
The distance off can be estimated as:
Distance off = 60 X Width / Angle
The angle can be measured by comparing compass bearing to either side of the object, but what makes this method practical for use in sea kayak is that angles can be estimated from holding your hand out at arms length:
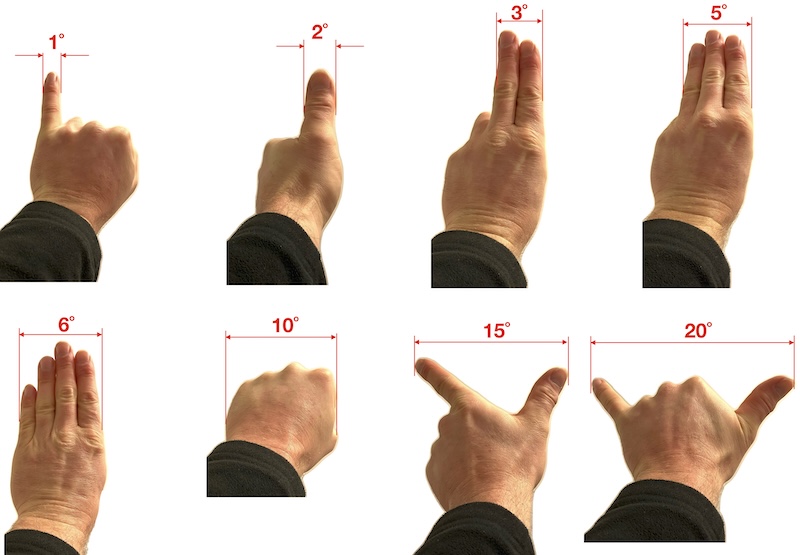
The island of Lundy is about 2.7 nautical miles long, north to south. Whilst approaching Lundy from the east, you notice that Lundy has the same width as your splayed hand thumb to pinkie. How far from Lundy are you?
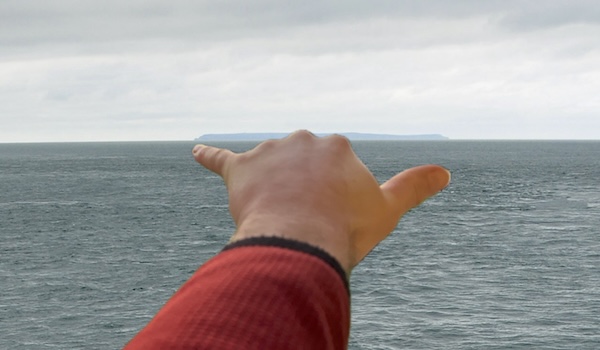
The angle indicated by your splayed hand is about 20˚. Using the relation:
Distance off = 60 X Width / Angle
Distance off = 60 X 2.7 / 20 = 8.1 nautical miles.
If you intended to use this method, you might have calculated 60 X 2.7 = 162 ahead of time, so that the only mental arithmetic that you have to do on the water is to divide 162 by 20.
Image background: Nilfanion/Wikipedia. Manipulated.
6.1.6 GPS
On a long open crossing, away from shore with few waymarks, using a GPS to navigate is an obvious choice. Traditionalists have long argued that relying on an electronic device that can break or malfunction (or be dropped in the sea) for navigation is unwise. They’re probably right - but nowadays the obvious solution is to take several GPS units with you. If a group of 4 each possess a dedicated GPS unit, a smartphone with wayfinding apps and GPS watches, it’s hard to imagine everything failing at once.
Do be cautious in using smartphones for navigation. Phones aren’t as robust as dedicated outdoor GPS units, can be less accurate and the battery life is often short when using wayfinding apps. Also, make sure you have a backup if you need to phone for help after the batteries run down.
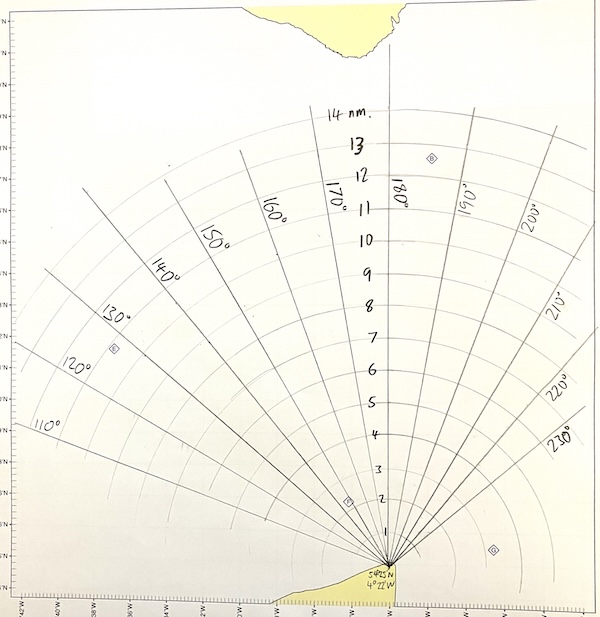
6.1.6.1 Chartwork for GPS use
Simply reading your position as latitude and longitude off a GPS and transcribing it onto the chart is slow and error prone. A better approach is tell your GPS your destination ahead of time (type it in on the shore, or even at home whilst you’re planning the trip) and get it to tell you the distance and bearing to there.
To make things easier, it helps to do some pre-work with your chart. Marking the chart with a ‘spider’s web’ of bearing and distance information allows to see at a glance where you are from a GPS bearing and distance to travel.
6.2 Open Water Navigation in tidal waters
6.2.1 Chartwork
Although it’s possible to do everything you need to on a chart with a hiking compass and a folding ruler, it’s much easier to have a few simple instruments and know how to use them.
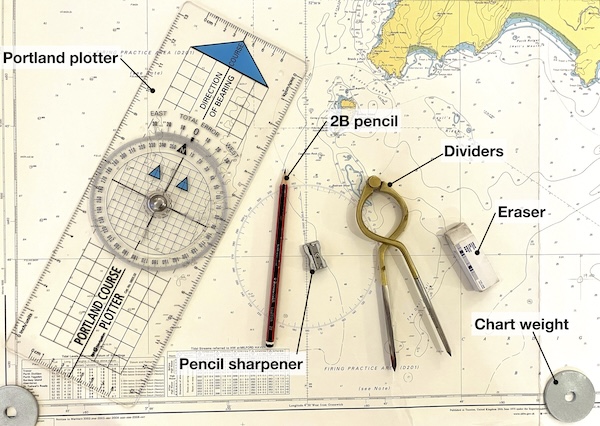
2B pencil: a soft pencil is preferred for chart work as it’s easier to erase once you’re done (or in the unlikely event that you make a mistake!).

Pencil sharpener: to keep your pencil nice and sharp
Eraser: to deal with any mistakes and remove the lines from the chart once your planning is complete so the chart is ready for the next time
Chart weight: Given the size of many charts, they tend to get stored rolled up, so it’s helpful to have something to weigh them down while you work on them. You can, of course, buy beautiful brass chart weights at great expense for this purpose. Large washers (e.g. M10 penny washers) cost almost nothing and work equally well.
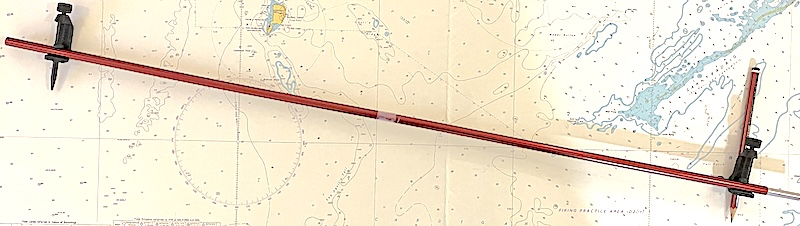
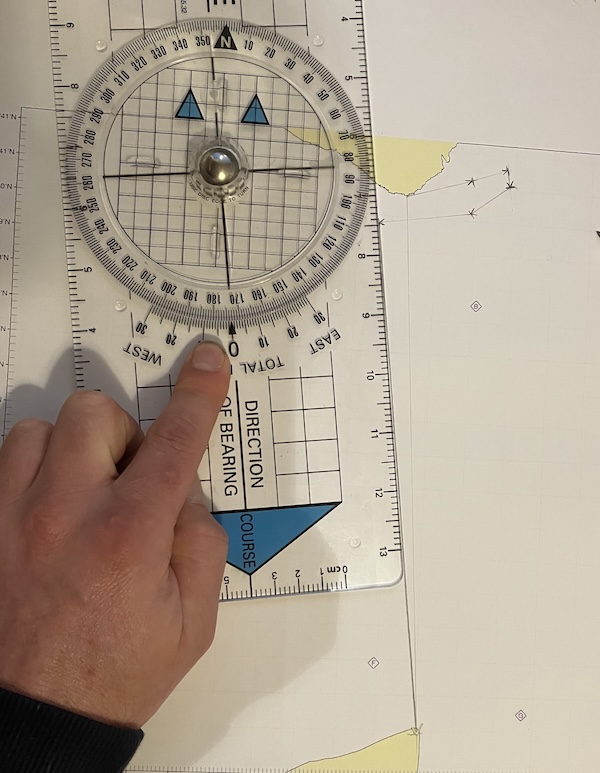
Plotters: The ‘Portland’ or ‘Breton’ plotter is basically a big hiking compass without the magnetic needle. It can be used to measure bearings and draw lines at define angles. It’s big enough to be useful as a straight edge too.
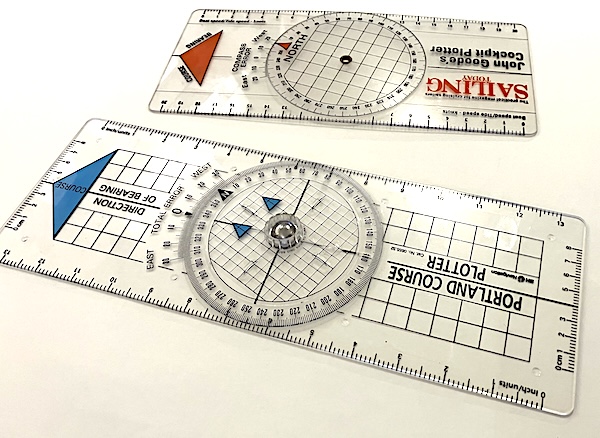
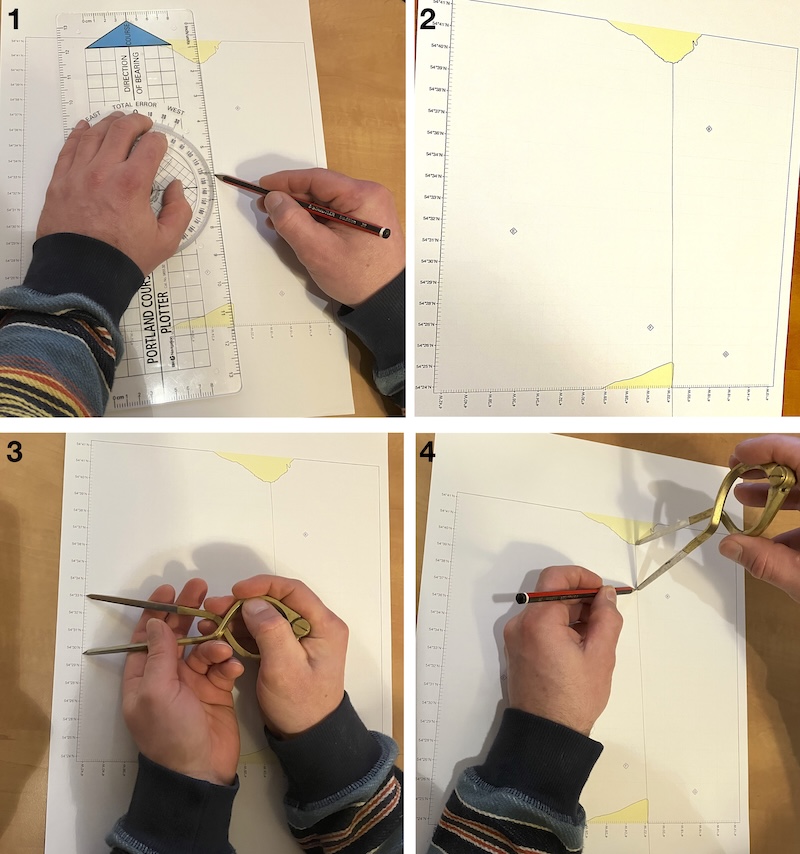
The Portland Plotter shown (below, blue parts) in the image below is rigid, easy to use and my preferred option for chartwork. You can buy these from many Chandlers and the RYA. The other plotter (above, red parts) is smaller, very thin and flexes. It’s much less nice to use, but easier to keep with pilots, books etc in you navigation ‘kit’ if you only intend to use it occasionally.
Dividers: Whilst a pair of drawing compasses will work, there’s nothing like a pair of brass dividers to bring a bit of mystique to your chart work. The shape of these dividers is intended to enable one-handed use.
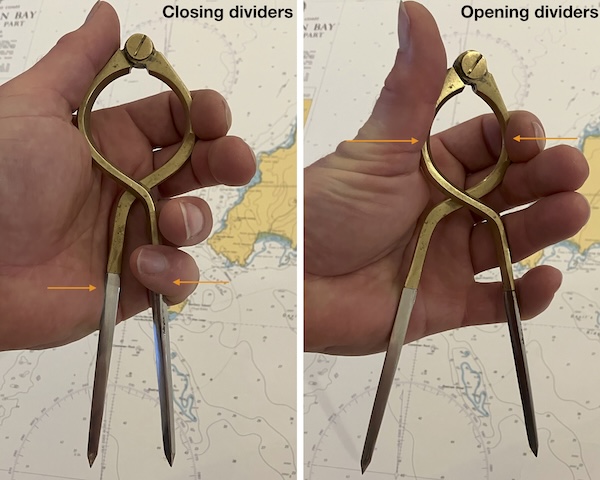
The dividers can be closed (i.e. made to measure less distance) by squeezing their legs together, as you might expect. The dividers can be opened (i.e. made to measure more distance) by squeezing the top part. This means that you can set the dividers with one hand. Notice that I’m using my left hand here as I prefer to hold my pencil in the right hand.
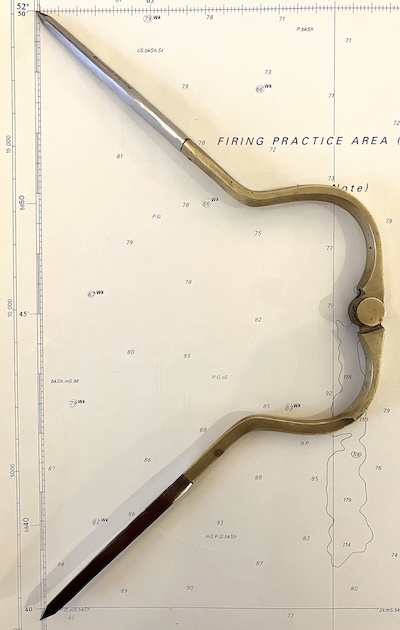
If longer distances need to be be measured, the dividers can be opened in the opposite direction:
For measuring and marking off larger distances, it’s possible to use the scale on a plotter or a long ruler. The right tool for the job is a beam compass or trammel.It’s now possible to buy these fairly cheaply online, but this hasn’t always been the case. I made mine from a pair of cheap trammel points attached to an old tent pole section:

Of course, the device can be made even longer by slotting on another section of tent pole and securing it with a bit of tape:
Most people are able to do without a beam compass, but it’s a nice to have if you’re planning lots of chart work, perhaps in the run up to an advanced leader assessment.
6.2.1.1 Measuring bearings
The plotter can be used in the same way as a hiking compass to measure a bearing off the chart
Find the bearing of the Causeway Buoy from the West Island of the Saint Tudwal’s Islands.
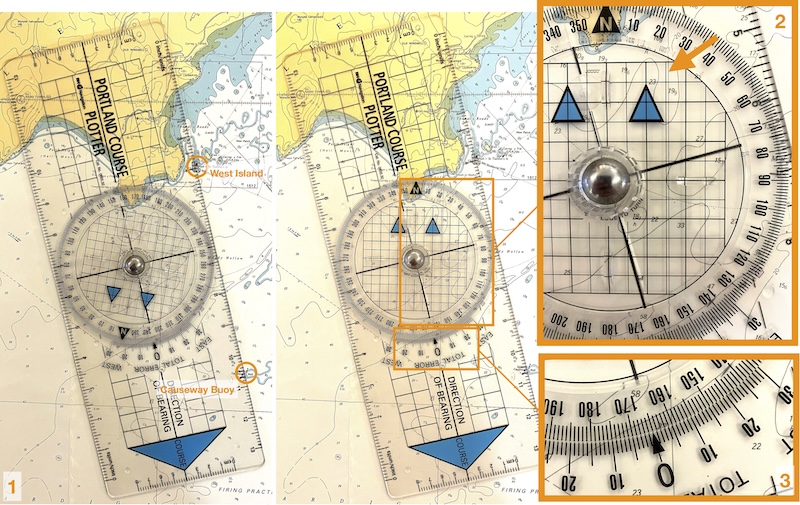
1: Place the plotter on the chart so that the bearing line is along one of it’s edges. Here we ensure that both the West Island and the Causeway Buoy are on the edge of the plotter.
2: Rotate the bezel of the plotter until the arrows on the bezel point to the north direction of the chart. Notice here how one of the vertical lines on the bezel has been carefully aligned with one of the gird lines on the chart (arrow).
3: Read off the bearing from the plotter - it’s 165˚, as measured at the ‘0’ arrow.
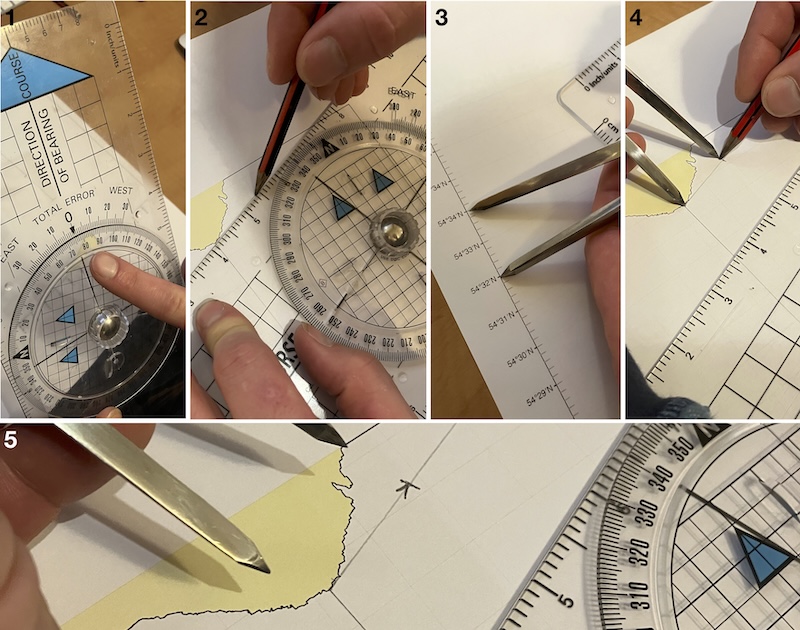
6.2.1.2 Marking vectors
We often need to mark lines of a defined length and direction to denote bearing of tidal drift or distance paddled. To do this, we use the plotter to find the correct direction and the dividers to transfer the required distance from the chart’s scale.
*Draw a 3 nautical mile line at bearing 130˚ from Carreg Ddu to denote tidal drift
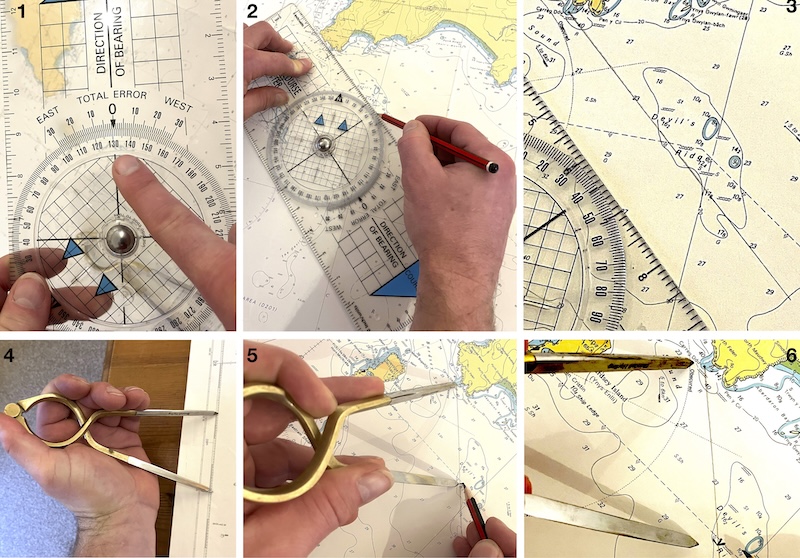
1: Set the plotter to the required bearing of 130˚
2: Place the plotter on the chart so that the lines and arrows on the bezel are aligned to north. Slide the plotter until its edge is at Carreg Ddu. Draw a line from Carreg Ddu that is somewhat longer than the 3 nautical miles required
3: The pencil line drawn at 130˚ from Carreg Ddu
4: Set the dividers to 3 nautical miles. Here the latitide scale on the chart is used
5: Place one point of the dividers at Carreg Ddu. Mark where the other point lies on the line.
6: Completed vector.
6.2.2 Long crossings
We’ve already looked at crossings of channels with tidal flow where the crossing took around an hour or less. With these short crossings, it’s reasonable to assume that the tidal stream remains constant throughout the crossing, making the vectors approach fairly simple.
If you’re planning a crossing that’s going to take several hours, the tidal stream is going to change its speed and possibly its direction during the crossing. Clearly that needs to be taken into account when planning the crossing.
6.2.2.1 Option1: Multiple 1 hour vectors
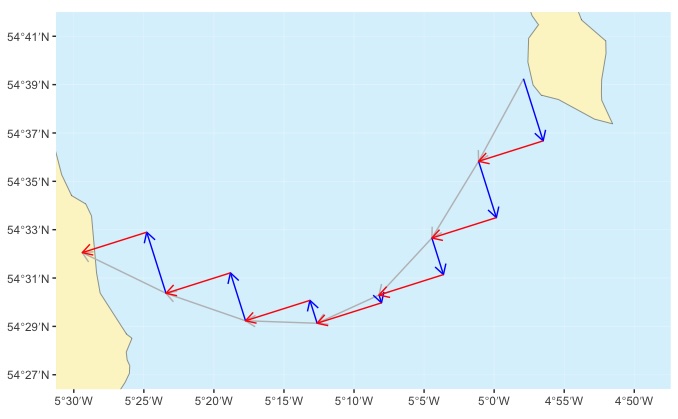
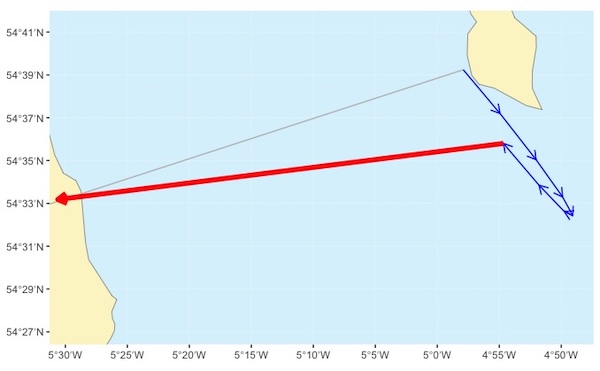
A simple approach to planning a long crossing is simply to apply the simple vectors approach to short crossings to each hour, aiming to stay on a straight line between the start and finish points. This works. Here’s a long crossing planned out using this technique:
For each hour, a blue vector has been drawn to represent how far the tide would make the kayak drift if the paddler did nothing for the hour. Then a red vector, representing the paddling speed had been added between the tip of the blue arrow and a (grey) line drawn between start and finish points for the crossing. As we saw in the simple vectors approach, the angle of the red arrows needs to be adjusted such that the end reaches the grey line.
As you can see from the map, the crossing is planned to take 10 hours. The paddler will need to adjust the bearing on which they paddle every hour. During some hours - e.g. the 1st and the 7th, the paddler makes very little progress towards their destination - they’re mostly just fighting the tide. And the paddler begins the crossing by paddling north-west to fight the tide…. but ends it by padding south-west against the tide once it’s turned.
So, whilst this method does work, it doesn’t seem to be very efficient. Let’s look at a better approach.
6.2.2.2 Option 2: Vectors over several hours
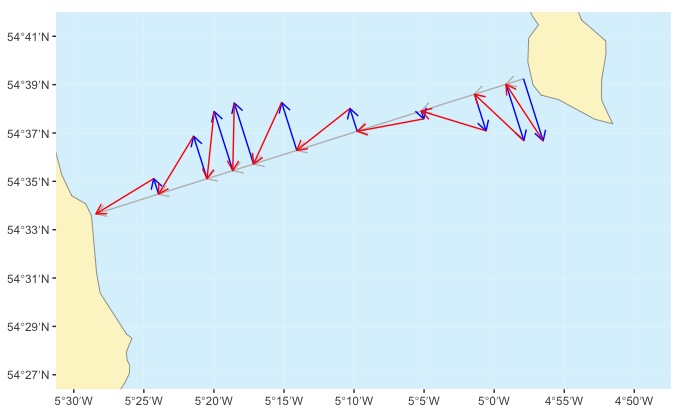
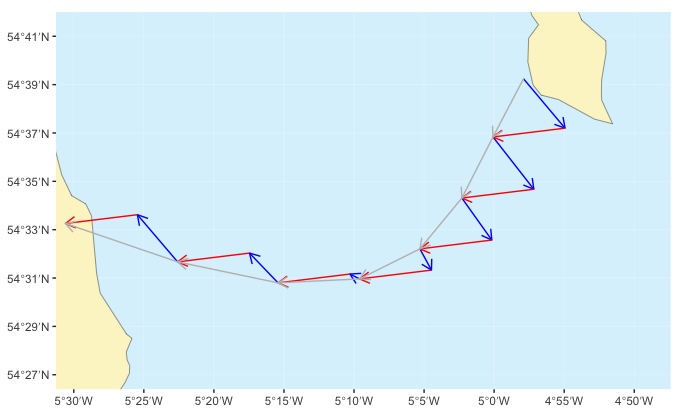
The big problem with the previous approach was that the paddler spends a lot of time fighting the tide in one direction, then the opposite direction. It would be better to simply let the tidal stream push the paddler south for the first 4 hours, then let the stream push them back northwards. Here’s the same trip, with the same tidal streams and paddling speed planned with this approach:
With this approach, the paddler steers a constant bearing throughout the entire crossing (red arrows). The tide (blue arrows) pushes the paddler south during the start of the crossing, then back north. Their course isn’t a straight line, but follows a curve (grey arrows). And notice that the crossing now only takes 7 hours to complete - little or no time is wasted paddling against the tide.
6.2.2.3 Introduction to multiple hour vector method
So, how do we calculate the course to steer for this more efficient approach? We begin by laying out all the tidal stream vectors, end to end for all the hours of the crossing:
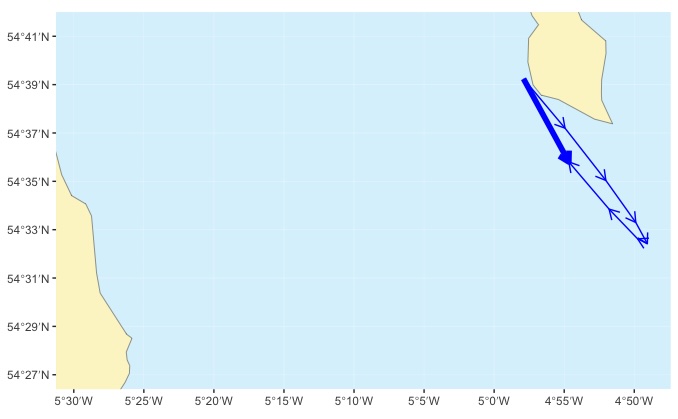
These (thin blue) arrows represent what would happen to the boat if we simply let it drift for 7 hours. If we want to, we can represent the total tidal drift by a single arrow (thick blue) that represents the total effect of the stream over the entire 7 hour crossing.
We now have a vector for the tidal effect, just like we had for the 1 hour vector triangle. We also know how far we can paddle during the crossing - it’s simply the crossing time (7 hours) multiplied by our paddling speed (e.g. 3 knots - to give 3X7 = 21 nautical miles). We have everything we need to draw a vector triangle that represents the entire 7 hour crossing, setting the direction of the 21 mile arrow so that it meets a line drawn from departure point to destination:
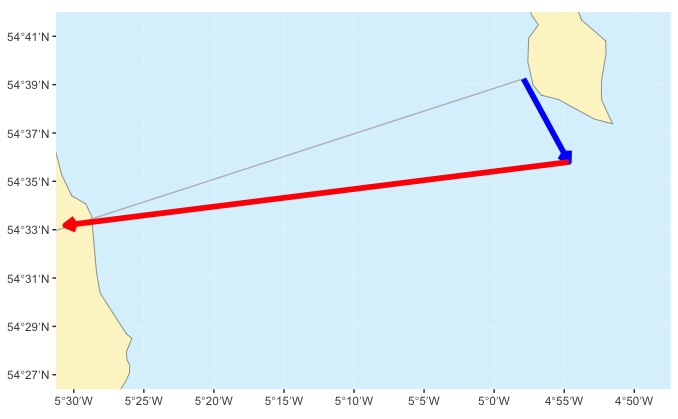
The bearing of the red arrow (~260˚) tells us the course we need to steer throughut the crossing. Note that the point where the paddling speed vector (red arrow) meets the line drawn from departure point to destination (grey line) is slightly beyond the destination. This simply indicates that the crossing will take a little less than 7 hours to complete.
If we like, we can now find our where we’re going to be during the crossing - remember that using this technique, we’re likely to end up following a curved path. We simply lay out the tide and paddling vectors for each hour:

For the first hour, we draw the tide vector for hour 1 (furthest right blue arrow) and draw a paddling vector with length equal to our speed (e.g. 3 knots / 3 nautical miles) along the bearing that we calculated for the course to steer (260˚) (furthest right red arrow). The end of this red arrow tells us where we’ll be after 1 hour of paddling.
For the second and subsequent hours, we do the same, starting at at the calculated position for the previous hour. This gives us the position at the end of each hour and our actual course (grey arrows). If you’ve got everything right, the final position should be somewhere near your planned destination.
That’s a very high level explanation of a somewhat complex process that requires a lot of chart work. We’ll go through it slowly, with an example, over the next few sections
For our example, we’ll plan a crossing from Burrow Head in southern Scotland to Point of Ayre, the northern point of the Isle of Man in August 2025.
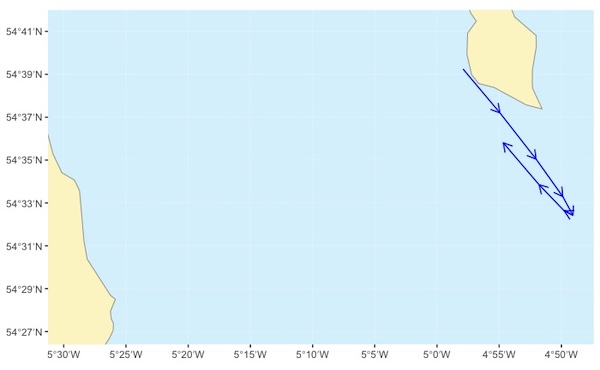
We’d likely plan this crossing on Admiralty chart 2094 “Kirkcudbright To Mull of Galloway & Isle of Man”, and the example will work fine if you want to do that. However, to make things easier to see, and to provide a chart that you’re able to print off without contravening copyright, We’re going to use the simplified chart here:
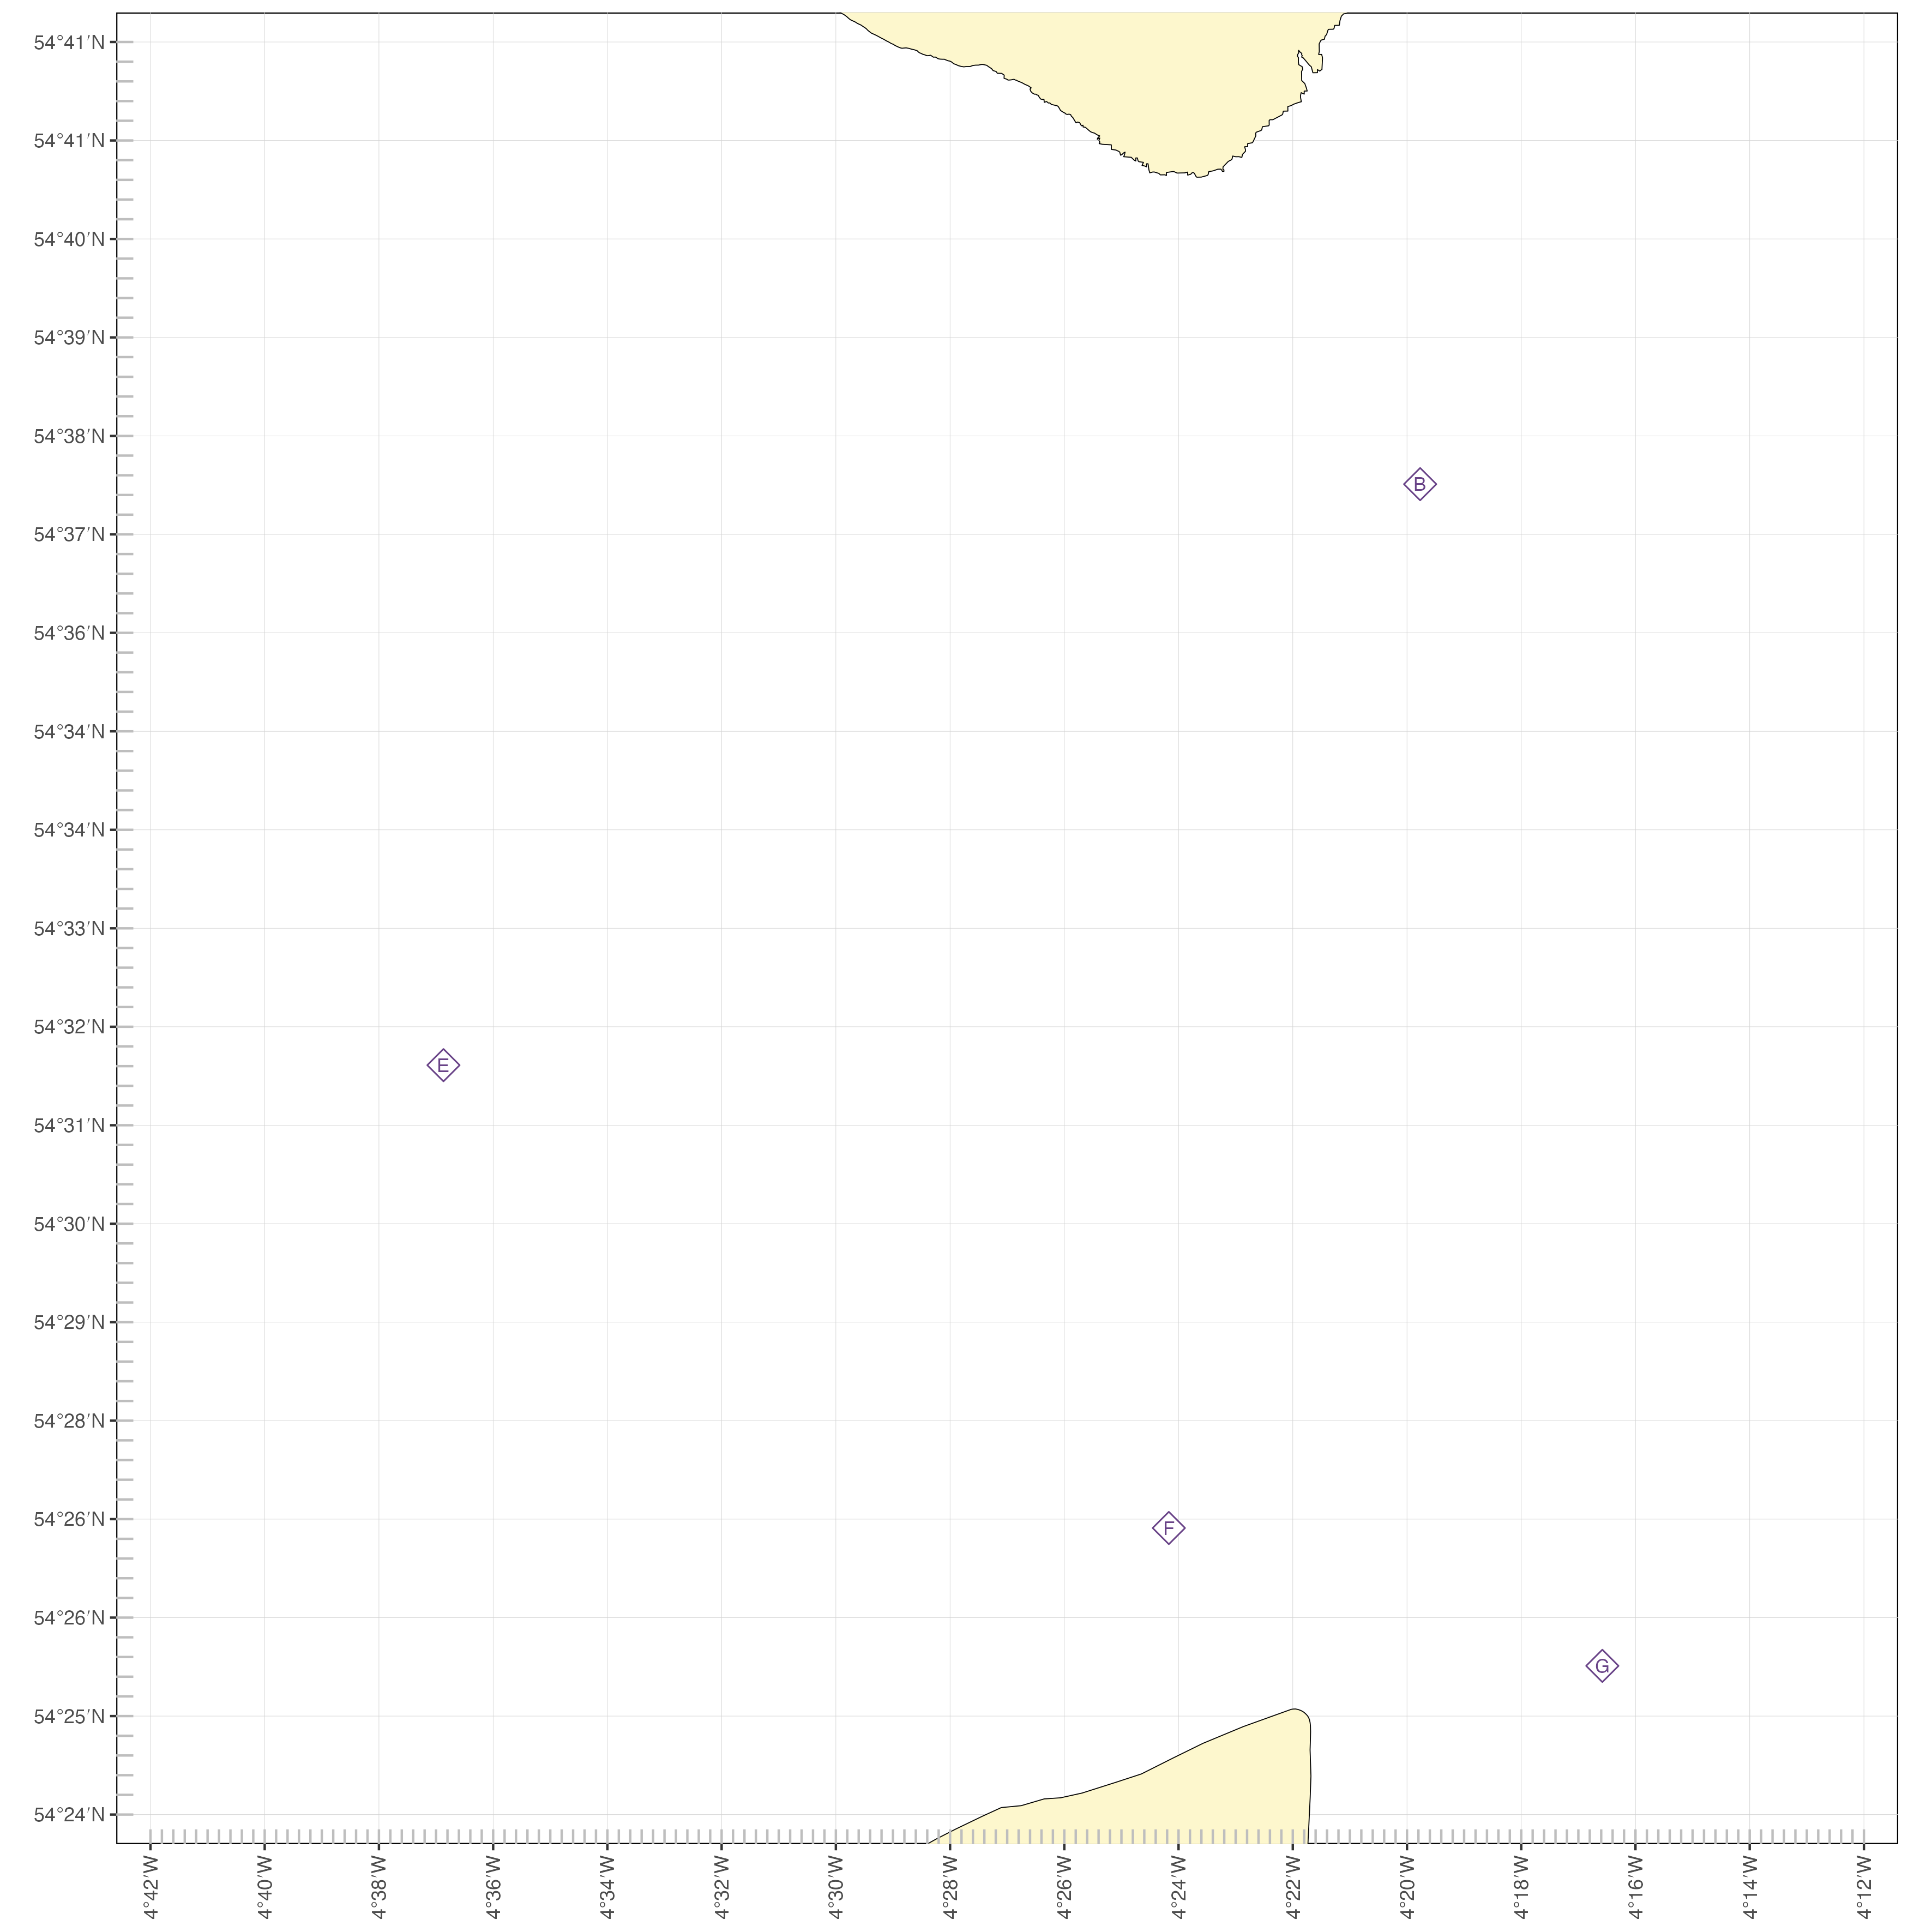
The chart has 4 tidal diamonds on it. Here’s the data for those diamonds:
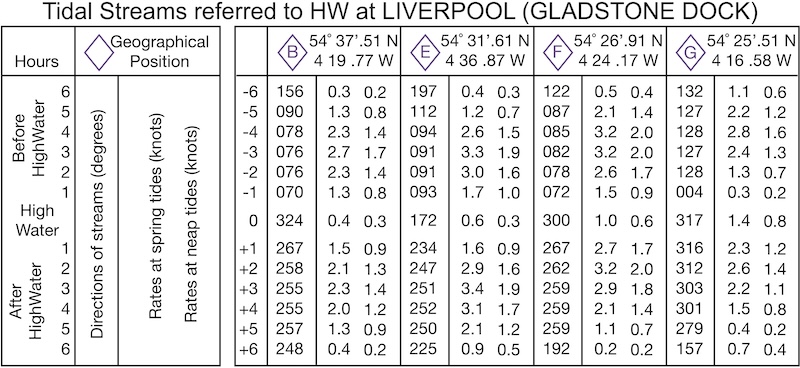
We’ll show how to use this information to plan the crossing in subsequent sections.
6.2.3 Choosing when to make the crossing
The first decision to make when planning a crossing is to choose when to go. The tidal streams that affect the crossing will make the journey much easier at some times than others. Often, tidal stream atlases can be a good source of information to gain the overview needed to begin thinking about this.Factors to consider include:
Whether it is springs, neaps or in between. The effects of the tide will be less around neaps, increasing margins for errors.
When the tide will turn. For crossing that cross the tide (e.g. most crossings from the UK mainland to Ireland), it makes sense to choose slack water in the middle of the crossing so that the effects of the tide cancel over the crossing and no net effort is put into paddling against the tide. For crossings in the direction of the tide (e.g. Ilfracombe to Lundy), it makes sense to cross when the tide will assist your passage.
Areas of overfalls. For some crossings, it will be important to avoid areas of overfalls and races when the tide is strong. For this reason, you might choose to arrive at a destination headland at slack water.
Periods of daylight. Some otherwise perfect time windows may be in the middle of the night, which is obviously not ideal. It may well be better to start the crossing in the dark than be chasing the last light at the end of the crossing.
When should you plan to make the open crossings shown on the maps below?:
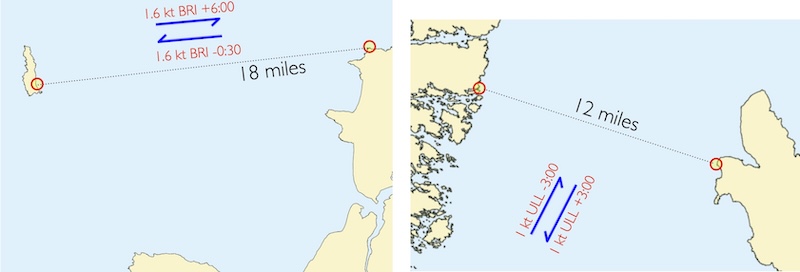
For the Lundy crossing, it makes sense to plan to be pushed to the island by the west-going tide. We expect the 18 miles to take most of the west-going flow period, so we’ll plan to depart Bull Point half an hour before high water at Bristol.
For the Hebrides crossing, we’re going across the tide. We want the tidal effects to cancel out over the crossing. We hence need slack water when we’re half way across - let’s say we’ll arrange this to be 3 hours after high water at Ullapool (3 hours before would work equally well). The crossing will take about 4 hours at 3 knots, so we aim to depart 2 hours before slack water at 1 hour after high water Ullapool.
It is possible that you will need to make some compromises. In some areas, picking neap tides will mean that the only usable slack water is in the middle of the night. Clearly, it’s not possible to time slack water for both the middle of your crossing and your arrival at a headland.
Obviously, the weather will determine whether it’s sensible to undertake the crossing - most people will only contemplate a multi-hour crossing in settled conditions. It may turn out that the day you pick has poor weather, and you’ll have to leave the crossing to another opportunity. Tidal conditions tend to be similar from one day to the next, so you may be able to pick the best day from 3 or 4 that all have a sensible tidal setup.
Here’s an extract from a tidal stream atlas showing the area between Burrow Head and the Point of Ayre
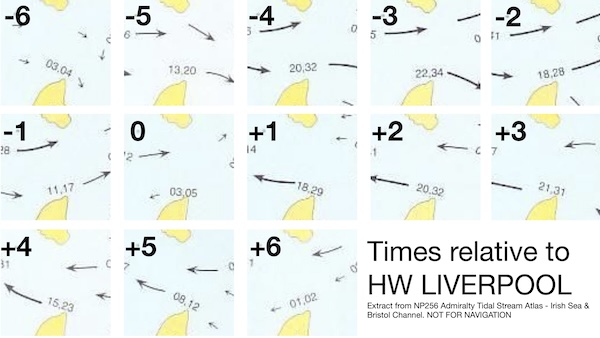
It appears that slack water is around high water Liverpool and HW Liverpool +6:30 (i.e. LW Liverpool). Around high water Liverpool, it looks like the tidal stream at Point of Ayre turns a little ahead of the main stream.
The distance of the crossing is around 15 nautical miles, so we expect it to take around 5 hours. We’ll arrange for the middle hour of the crossing to be around slack water at HW Liverpool (or LW ), so that we start around 2 and a half hours before high water or low water at Liverpool and finish 2 and a half hours after. So, we’re looking for days with a small tidal range and HW or LW near the middle of the day.
We’d like to do the crossing in August 2025. Here’s a tide table for that month:
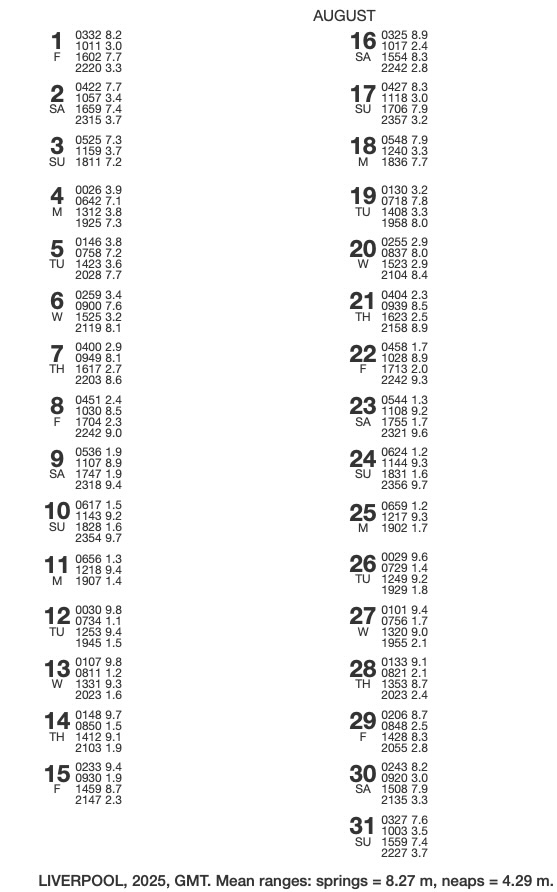
The smallest tidal range of the month is August 4th. On this day, we might use the low water slack at 14:12 (accounting for BST). Similar conditions, with slightly larger tidal ranges occur on the 18th and 19th. These days look optimal from a tidal perspective.
However, to make some of the principles clearer in this example, we’ll choose a day with a rather larger tidal range - the 9th August. On this day, high water is at 12:07 BST and the tidal range is 7 metres. For simplicity, we’ll assume high water at 12:00. The timings for the crossing are thus:
| Time relative to HW Liverpool | Time (BST) | Expected tidal stream |
|---|---|---|
| -2 (-2:30 to -1:30) | 09:30-10:30 | East-going, strong |
| -1 (-1:30 to -0:30) | 10:30-11:30 | East-going |
| 0 (-0:30 to +0:30) | 11:30-12:30 | Slack |
| +1 (+0:30 to +1:30) | 12:30-13:30 | West-going |
| +2 (+1:20 to +2:30) | 13:30-14:30 | West-going, strong |
We’ll update this table as we gather more information about the tidal streams.
This plan involves us arriving at Point of Ayre with a strong west-going tide running. We may wish to check how severe the overfalls are likely to be at the Point, and devise a plan that enables us to land to the west of the point should we get swept in this direction.
6.2.4 Finding tidal stream data for long crossings
The tidal stream data that we use for crossings can come from any of the usual sources - e.g. pilots, guidebooks or stream atlases. If we’re going to use the information for formal navigation, it makes sense to use the most accurate data that we can. Where possible, we’ll tend to use tidal diamonds. However, in some places there simply aren’t tidal diamonds available and in others we may need to augment them with other information sources, for example to account for faster flows near the shore.
During a long crossing, we may pass through areas that have different tidal streams. We need to decide what source of information to rely on for each hour of the crossing.
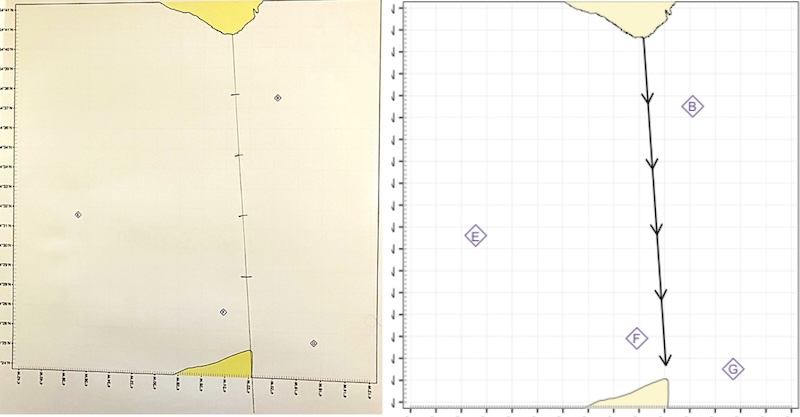
To do this, we need to estimate where on the crossing we expect to be at each hour. To do this, draw a line from the start point to the end point, and mark off 1 hour distances each corresponding to a hour’s paddle (e.g. 3 nautical miles for 3 kt paddling speed):
This approach assumes that our progress along the crossing won’t be greatly affected by the tide. This is reasonable for crossings across the tide with slack water in the middle of the crossing. If we’re paddling down tide, we can modify our speed accordingly.
We can now choose which tidal data to use for each hour. In the illustration above, we might choose to use:
Data from pilot books or guidebooks, shown as blue arrows, for hours 1 and 4 to account for the stronger flows inshore
Diamond D for hour 2
Diamond F for hour 3
Of course, this choice is subjective. If we believe that the inshore flow at the western end of the crossing is very localized near the coast, we might choose to use diamond F for hour 4… and plan to deal with the localized flow once we get there - perhaps using transits, or planning to arrive suitably up-tide of our final destination.
We’ll need to use the techniques that we’ve learned in earlier sections to determine the tidal flows that we expect on the day in question.
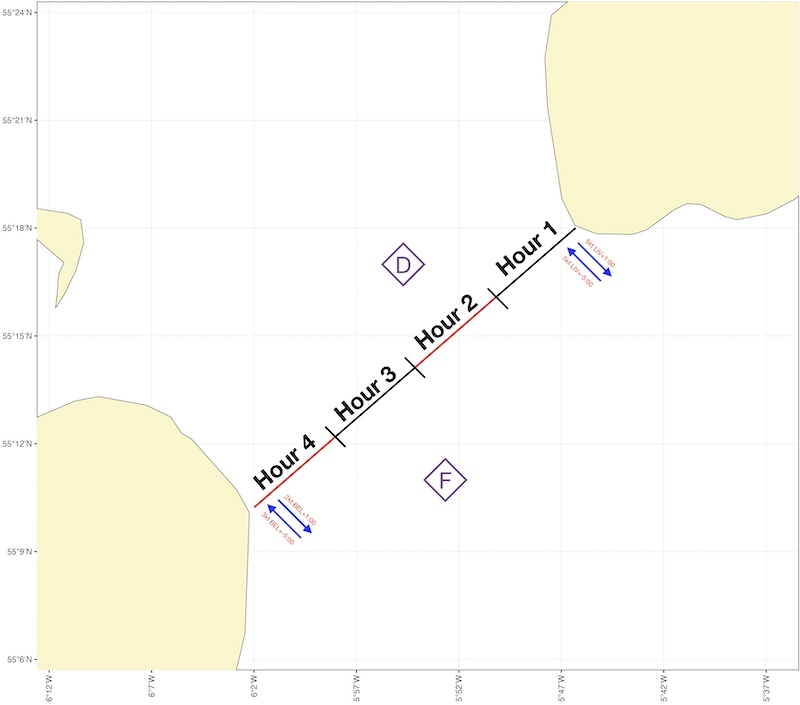
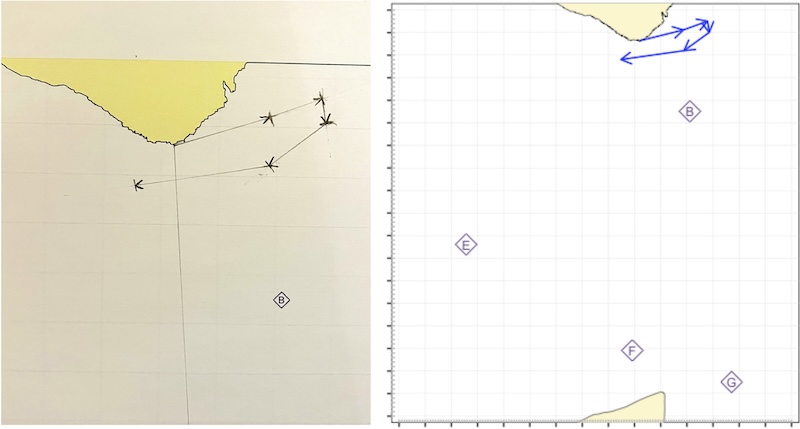
For our example crossing, the best information available is from a series of tidal diamonds. We need to decide which to use for each hour.
Begin by drawing a line from the start point of the crossing to beyond the end (the extended line will be useful later). Then mark off each hour of paddling distance along the line. On this crossing, we expect to paddle at 3 knots, so we mark every 3 nautical miles:
The final result is shown below:
We can now decide which diamonds to use for each hour of the crossing. Clearly, we will want to use diamond B for the first 2 hours. Diamond F would be a good choice for the final hour (it’s closer to the crossing line than diamond G), but will likely be too much affected by it’s proximity to the Point of Ayre to be a sensible choice for other parts of the crossing.
For hours 3 and 4, you could choose to use either diamond B or diamond E. Diamond B might better reflect the way the tide is ‘squeezed’ into the channel that we’re crossing, but diamond E may better reflect the conditions in the middle of the channel. Looking a a tidal stream atlas might help you to make the choice, but it is subjective. We’ll choose diamond E:
| Time relative to HW Liverpool | Time (BST) | Source of tidal data |
|---|---|---|
| -2 (-2:30 to -1:30) | 09:30-10:30 | Diamond B |
| -1 (-1:30 to -0:30) | 10:30-11:30 | Diamond B |
| 0 (-0:30 to +0:30) | 11:30-12:30 | Diamond E |
| +1 (+0:30 to +1:30) | 12:30-13:30 | Diamond E |
| +2 (+1:20 to +2:30) | 13:30-14:30 | Diamond F |
We can now copy the required data from the tidal diamonds. The required information is highlighted below and captured in the next version of our table:
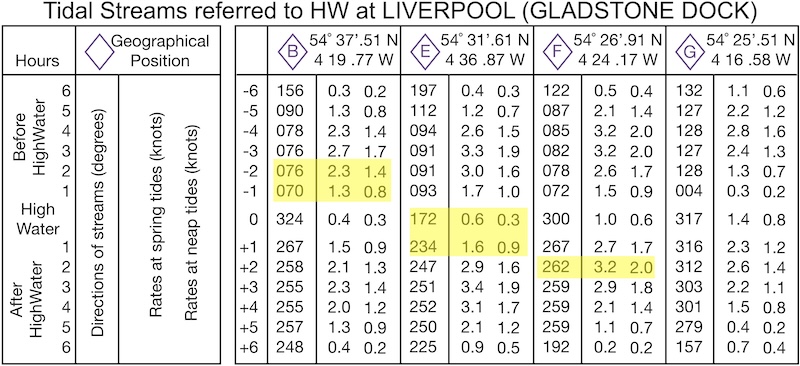
| Time relative to HW Liverpool | Time (BST) | Source of tidal data | Bearing | Spring rate | Neap rate |
|---|---|---|---|---|---|
| -2 (-2:30 to -1:30) | 09:30-10:30 | Diamond B | 76˚ | 2.3 kt | 1.4 kt |
| -1 (-1:30 to -0:30) | 10:30-11:30 | Diamond B | 70˚ | 1.3 kt | 0.8 kt |
| 0 (-0:30 to +0:30) | 11:30-12:30 | Diamond E | 172˚ | 0.6 kt | 0.3 kt |
| +1 (+0:30 to +1:30) | 12:30-13:30 | Diamond E | 234˚ | 1.6 kt | 0.9 kt |
| +2 (+1:20 to +2:30) | 13:30-14:30 | Diamond F | 262˚ | 3.2 kt | 2.0 kt |
We can now use the tidal range on the day we’ve chosen for the crossing (7 metres) together with the neap and spring ranges at Liverpool (8.27, 4.29 metres) to calculate the expected flow on August 9th. We might use a graphical or a numerical method to do this - see the earlier notes on ‘Predicting speeds of tidal streams’ for how to do this. Here’s the results:
| Time (BST) | Source of tidal data | Bearing | Spring rate | Neap rate | Expected rate August 9th |
|---|---|---|---|---|---|
| 09:30-10:30 | Diamond B | 76˚ | 2.3 kt | 1.4 kt | 2.0 kt |
| 10:30-11:30 | Diamond B | 70˚ | 1.3 kt | 0.8 kt | 1.1 kt |
| 11:30-12:30 | Diamond E | 172˚ | 0.6 kt | 0.3 kt | 0.5 kt |
| 12:30-13:30 | Diamond E | 234˚ | 1.6 kt | 0.9 kt | 1.4 kt |
| 13:30-14:30 | Diamond F | 262˚ | 3.2 kt | 2.0 kt | 2.8 kt |
6.2.5 Plotting tidal streams
Now we’ve determined the tidal streams for each hour of the crossing, we plot the tidal drift for each hour of the crossing onto our chart. We plot the tidal vectors end to end, reflecting the fact that we expect the tidal drifts to occur sequentially through the crossing:
At this stage, we can see the aggregate effect of our tidal drift through the crossing. In the example above, it’s somewhat to the south. This might be ideal if our crossing heads SSW, but if we’re planning a directly westerly track, we might want to reconsider the timing of our crossing. In the example above, we might consider leaving an hour later to see if that makes the aggregate effect of the tidal streams less.
In the previous section, we calculated the tidal flow for each hour of our example crossing:
| Time (BST) | Bearing | Expected rate August 9th |
|---|---|---|
| 09:30-10:30 | 76˚ | 2.0 kt |
| 10:30-11:30 | 70˚ | 1.1 kt |
| 11:30-12:30 | 172˚ | 0.5 kt |
| 12:30-13:30 | 234˚ | 1.4 kt |
| 13:30-14:30 | 262˚ | 2.8 kt |
So we’re going to mark a series of arrows:
For hour 1: at a bearing of 76˚, with a length of 2 nautical miles
For hour 2: at a bearing of 70˚, with a length of 1.1 nautical miles
etc…
Begin by marking the first hour’s tidal drift: 2 nm at 76˚:
Now we mark the remaining hours end to end:
6.2.6 Finding the course to steer
We now need to determine the course to steer. This process is similar to that which we used for short crossings.
We set a compass or a pair of dividers to the total distance that we plan to cover in the planned duration of the crossing. We place one point of the dividers at the end of our final tidal drift arrow, then swing them until they reach the line drawn from our start point through the destination:
As for short crossings, we need to avoid the error of drawing this arrow to the destination point. However, with these longer crossings, it is likely that the arrow will end up close to the destination point. If it does not, we may have accounted for too many or too few hours of tidal drift.
We set the dividers to the total distance that we plan to paddle - 5 hours at 3 knots = 15 nautical miles. We then place one point at the end of our final tidal drift arrow and swing the dividers until they meet the planned course line:

We now mark off the point where the divider point meets the course line and draw our course to steer vector:

Finally, we can use the plotter to measure the bearing of the course to steer. Once we’ve corrected for magnetic deviation, this is the compass course for us to steer during the crossing.
6.2.7 Determining estimated positions
We’ve determined a course to steer, which we intend to hold constant throughout the crossing. We know that the tidal stream will vary through the crossing, so we’ll follow a curved track relative to the seabed. It is useful to find out what this track will be. Firstly, this allows us to check that we’re not going to end up somewhere that we don’t want to be - e.g. in a shipping lane or an area of overalls. Secondly, we can use these estimated positions to check our progress - by comparing them to our actual positions each hour, determined by GPS or other means.
The estimated positions are used by sequentially laying out the tidal drift vector (different each hour), then the paddling vector (the same each hour).
In the diagram, the tidal drift arrows are shown in blue and the paddling arrows in red. We’ll follow a track that is close to the grey line.
We’ll remind ourselves of the tidal drifts we expect each hour for our example crossing:
| Time (BST) | Bearing | Expected rate August 9th |
|---|---|---|
| 09:30-10:30 | 76˚ | 2.0 kt |
| 10:30-11:30 | 70˚ | 1.1 kt |
| 11:30-12:30 | 172˚ | 0.5 kt |
| 12:30-13:30 | 234˚ | 1.4 kt |
| 13:30-14:30 | 262˚ | 2.8 kt |
In the previous section, we calculated that our course to steer is 173˚ - and, of course, our paddling vectors will be 3 nautical miles for each hour given our 3 knot paddling speed.
So, we’ll draw out:
Hour 1 tidal drift arrow: 2 nautical miles at 76˚
Hour 1 paddling arrow: 3 nautical miles at 173˚
Hour 2 tidal drift arrow: 1.1 nautical miles at 70˚
Hour 2 paddling arrow: 3 nautical miles at 173˚
Hour 3 tidal drift arrow: 0.5 nautical miles at 172˚
Hour 3 paddling arrow: 3 nautical miles at 173˚
etc…
We’ll end up with a plot that looks something like this:
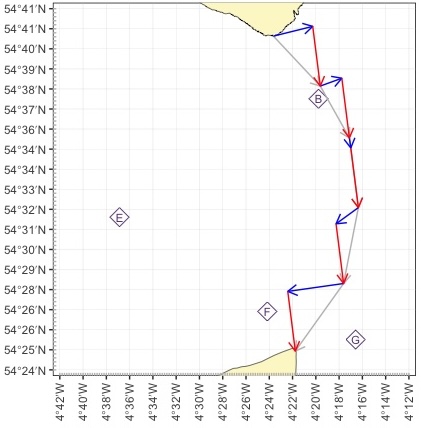
The tidal drift arrows for each hour are shown in blue, the paddling arrows in red. Our course is going to follow the grey lines.
6.2.8 Summary
As youve now seen, planning multi-hour crossing is rather involved process. Let’s summarize the key steps:
Find distance and estimate time for the crossing
Source overview tidal data, work out a day to go and timing for the half-way point
Work out departure time, and timings for each hour
Select tidal data source for each hour
Find tidal stream bearing and speed for each hour (using interpolation)
Plot the drift for the whole crossing
Use the dividers to find a course to steer
Plot expected positions for each hour
6.3 Risks and challenges of open crossings
Clearly, open crossings present challenges that coastal journeys with regular take-outs do not. It’s advisable to take a conservative approach - starting with short crossings (less than an hour) in calm conditions (less than F2 wind), no tide and ideally with an experienced companion. You may then choose to increase the distance and the challenge gradually as you gain experience.
Here’s a few of the factors that you may need to think about:
Wind/sea: the majority of open crossings are carried out in fine weather with minimal wind. Some experienced paddlers will choose to paddle downwind in stronger winds, but this is very much an advanced tactic - the fetch of the wind and hence the size of the waves will keep increasing through the crossing! It makes sense to choose settled periods of weather - you don’t want the weather to change whilst you’re at sea. Decide in advance what upper limits for wind and waves you are happy with and recognize that you may not get the conditions that you need.
Fog: Choosing low wind conditions may expose you to the risk of fog, especially during Spring or Autumn. Poor visibility can lead to disorientation unless you have absolute faith in your compass and/or GPS. Obvious dangers are other vessels (consider putting out a message on your VHF) and missing your target if it’s an island.
Thunderstorms: Warm windless summer days can have thunderstorm risks. Check the forecast - it isn’t sensible to head out if there’s a chance of lightning.
Other vessels: Ships won’t expect to see paddlers far from land, but many crossing will go across shipping routes. Check the chart to see where the shipping lanes are and when you’ll be in them. Have a VHF radio to hand in case you need to contact other vessels and be prepared to take evasive action. If you’re not sure about whether another vessel is on a collision course, take a bearing to it, then repeat after a few minutes. If the bearing stays constant you’re heading towards the vessel.
Fitness: Clearly you need to have absolute confidence that you can paddle effectively for the duration of the planned crossing - and have some contingency just in case something goes wrong (e.g. an unexpected headwind in the last few miles). It makes sense to undertake appropriately long journeys along a coastline before you commit to similar distances on a crossing. Develop an efficient paddling stroke and learn to vary it (e.g. high-angle to low angle, left handed/right handed) to use different muscles. Good paddles make a big difference (consider carbon paddles and/or wings), and it’s good to be able to vary length and feather. Drip rings can keep hands dry, leading to less blisters. Recognize that, in the worst case, you may need to tow one of your companions for a significant part of the crossing.
Hydration / Nutrition: Like all your kit, you’ll need to ensure food and drink are accessible from the cockpit. Drink little and often - a bladder-based hydration system can help by allowing you to drink whilst paddling. Eat well before the crossing and have snacks to hand during the paddle. Don’t try novel foods (e.g. energy gels) on the day - it’s not a good time to find that a particular product makes you sick!
Going to the toilet: Given the need to stay hydrated, it’s likely that you’ll need to pee at some points on a long crossing. I keep an old drinks bottle behind my seat for that purpose, and paddle with friends who I know well enough to ask to steady the boat whilst I go! Females have additional challenges - whilst it is apparently possible to manage things seated, many will choose to keel, stand or squat whilst rafted up. Some use the ‘Shewee’ device or similar (begin by practicing in the shower). On a very warm day, jumping in for a swim may be a good option. Whatever you choose to do, practice when the consequences of a mistake are low before you rely on the system.
Looking after yourself: Watch out for the effects of the sun that often accompanies ideal days for a crossing. Use plenty of sunscreen, lips sun block and sun hats. If blisters start to form on your hands consider using electrical tape to cover them before they get worse. Rubs (e.g. under armpits) can be treated with ‘Sudocrem’ or ‘Vaseline’.
Paddling skills: You must be able to deal with any rough water and swell expected on the crossing, and be able to maintain effective forward paddling in those conditions. If you’ve planned slack water for the middle of the crossing, it’s likely that flow may be significant at the start and end of the crossing.
Group ability: Everyone in the group needs to have the skills to complete the crossing, but there’s an obvious safety benefit to having an experienced leader, guide or coach.
Emergency procedures: Rescue skills should be well-practiced in the group - including dealing with paddlers separated from their boats and swamped hatches.
Calling for help: Have options for emergency communications - consider VHF, satellite phones, personal locator beacons, mobile phones and flares.
Navigational backups: On a along crossing a GPS system makes sense, but you should have backups, including additional GPS units, spare batteries, and the ability to complete the crossing on a compass bearing. Ensure you have several copies of the chart in the group.
Time of year: Whilst settled weather can occur at any time of year, you’re more likely to get a good weather window in the summer. The warmer water in late summer / early autumn offers an additional safety margin and may reduce the likelihood of sea fog.
Clothing: It helps to be able to adjust your clothing during the crossing if you get too warm or cold. Separate cags and trousers offer more options than single piece drysuits. Have a storm cag in your day hatch and a warm hat to hand.
Commitment: The level of commitment varies with the crossing - length is important, but so are the strength of the tidal streams and their direction (is it possible to return to your launch point after you’ve left?). Crossings can be psychologically difficult, but reducing sources of uncertainty (e.g. by attending to everything on this list) can help.
Resting: You need to feel stable enough in the boat to rest at sea. Rafting up can be a good option, but may be difficult in some conditions. Be organised and disciplined with rest stops - e.g. set aside 5 minutes every hour and stick to that. During rests, stretch your back, shoulders and legs.
Boredom: Long paddles in calm conditions without landmarks can become tedious. Choose your group carefully, and perhaps devise some simple games (e.g. 20 questions) to keep people interested.
Solo paddling: Going solo on open crossings carries obvious additional risks, but for some paddlers the sense of achievement is similarly high.
For those looking for more ideas and advice, Doug Cooper’s book ‘Rough Water Handling’ has a good section on open crossings.