3 Tides
Understanding the tides is crucial for planning and carrying out safe sea kayak trips.
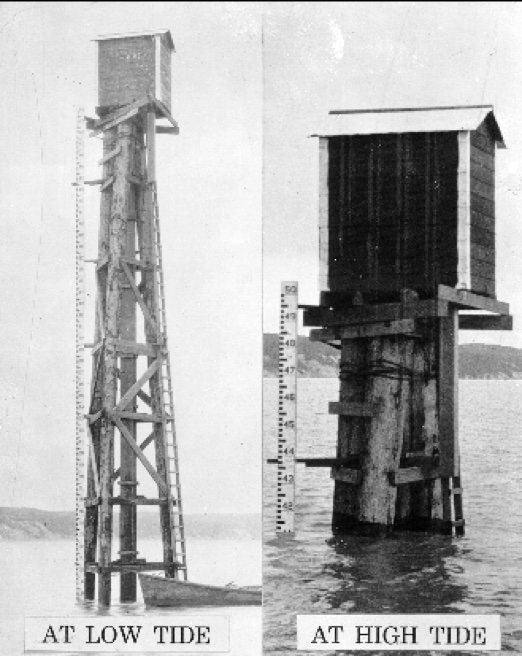
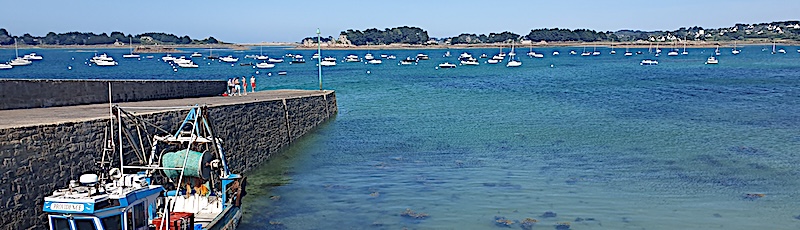
In some areas of the UK, the falling tide uncovers vast areas of seabed, making some channels unusable and possibly making launching and landing difficult. This can be particularly problematic around the Norfolk coastline and other areas with large shallow sand and mud flats.
The rise and fall of the tides creates flows known as ‘tidal streams’. 4 knot tidal streams are not unusual and some parts of the UK coastline experience 9 knot streams. Paddling against tidal streams can slow progress, or simply be impossible, so being able to predict them and account for them in trip planning is important.
3.1 What causes the tides?
3.1.1 The moon
The principal cause of tides is the gravitational pull of the moon on the earth’s seas. The gravitational force exerted by the moon reduces with increasing distance. So, the seawater nearest the moon is pulled towards the moon more strongly than the earth, resulting in a high tide. On the opposite side of the earth, the seawater is attracted towards the moon less strongly than the earth, resulting in another high water. Low water occurs at the midpoints.
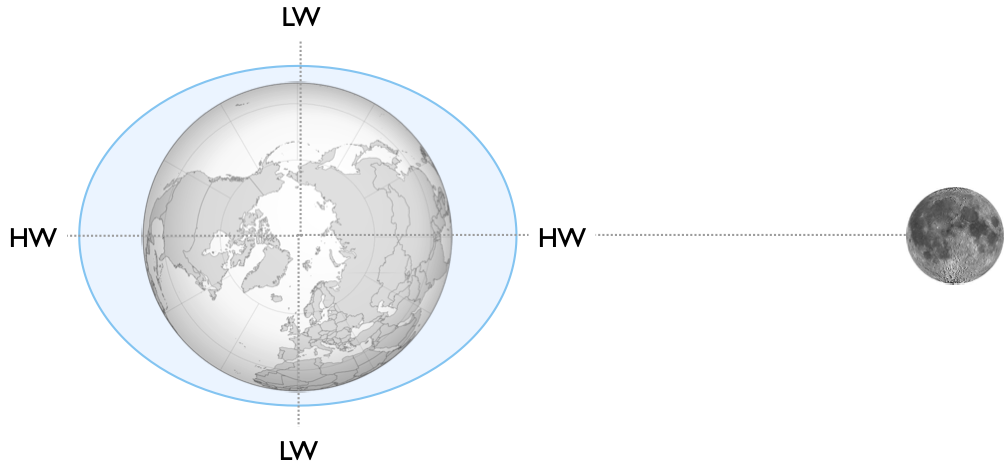
The earth rotates relative to the moon, causing the water level at each point on its surface to rise and fall.
In practice, this picture is highly simplified – the land disrupts this model of a perfect water-covered sphere. The reason we get two (often large) tides a day in the UK is to a large extent due to resonant effects in the Atlantic ocean and the concentration of tides due to the shape of the land. However, let us return to our simple water-covered sphere model….
The earth rotates once every 24 hours. So, every 24 hours, a point on the earth should see 2 high waters and 2 low waters.
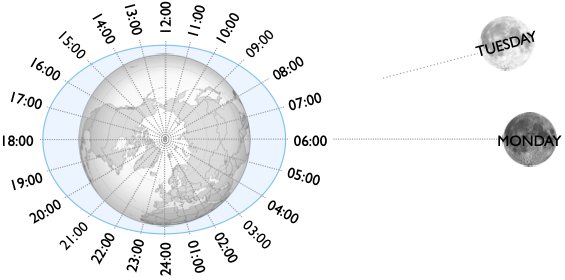
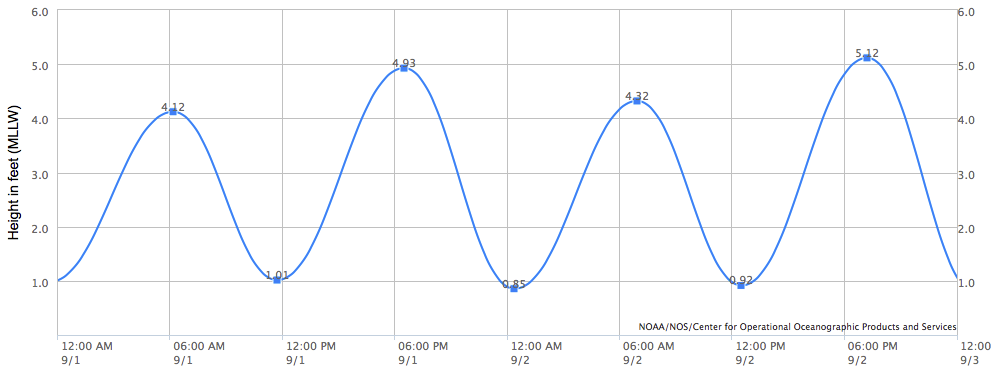
The moon orbits the earth on an approximately monthly cycle. So, once the earth has completed a full revolution, the moon will have moved a little. This has the effect of making high water occur about one hour later each day. The curve below shows typical tidal cycles over 2 days. Note that there are two high tides and two low tides each day. High water is around an hour later on the second day.
3.1.2 The Sun - neaps and springs
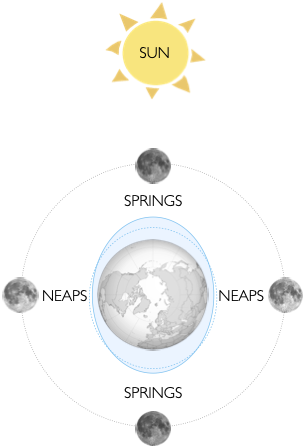
The sun is much further from the earth than the moon, but also much bigger. The net result is that it has a less significant, but still important, effect on the tides. When the sun and moon are in line, tides will rise higher and drop lower than if the sun and moon act perpendicular to each other.
The large tides caused by the combined pull of sun and moon are known as spring tides. The smaller tides caused by them pulling out of line are called neap tides. Note that spring tides are nothing to do with the seasons. They occur roughly every two weeks throughout the year about 1-2 days after each full or new moon. The time between spring and neap tides is about 7 days, so if you get big tides one weekend, expect smaller tides during the next one.
Tidal range is defined as the difference in the height of water between successive high and low waters. During a spring tide, the tidal range will be around twice that of a neap tide, so about twice as much water will be moving about.
There are also variations in the tidal range over the course of a year. In the UK, we often experience larger tidal ranges around the spring and autumn equinoxes because the angle of the earth’s rotation is square to the plane of the sun and the moon at that time (more detailed explanation here). The tidal range is also affected by:
The distance of the moon from the earth - this varies because the moon’s orbit isn’t a perfect circle. When spring tide coincides with the moon being close to the earth, the range will be especially large - this is called a ‘perigean springs’ - perigee being a term for the lowest part of an orbit. Spring tide ranges will be lower when the moon is furthest away - called the ‘apogee’ of the orbit - we call this an ‘apogean springs’ (more info here).
The distance of the moon from the sun - the sun’s orbits is also elliptical. The effect is smaller, but the tidal range is increased when the sun is closest to the earth - known as ‘perihelion’.
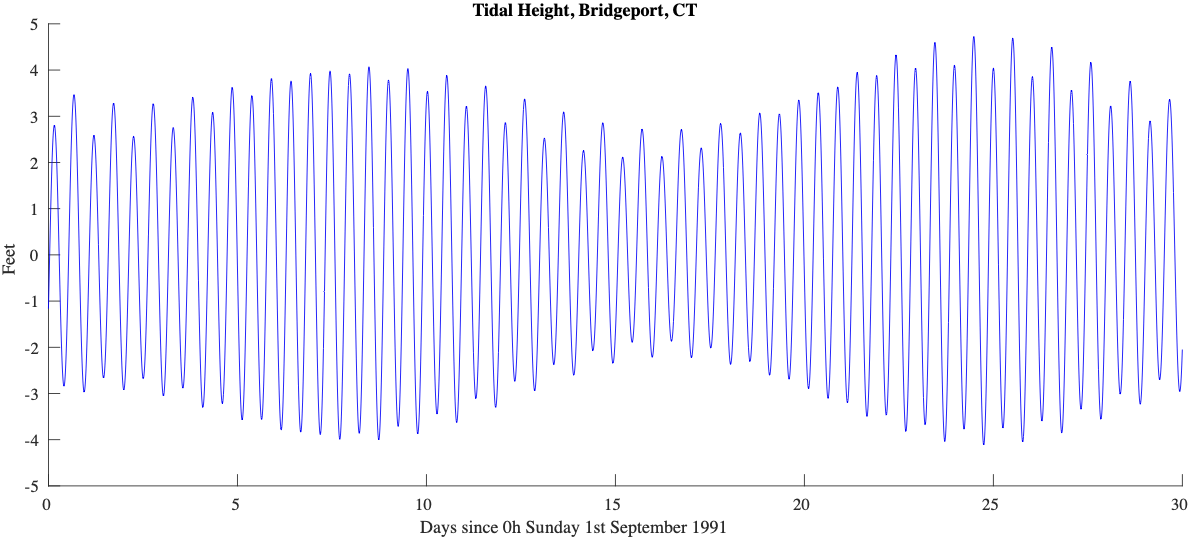
In practice, there are many other factors affecting the tides, making predicting times of high and low water a specialized science. The tide is modeled as a combination of sine waves, each with it’s own size and timing (phase). These have names like ‘M2’ - M2 is the twice daily effect of the moon that we described as the main cause of tides above. Of course, as the earth rotates the direction of the sun’s gravity changes on a daily basis, leading to a coefficient called ‘S2’. As the M2 and S2 waves drift in and out of phase, we see the emergence of neap and spring tides.
In addition there are around 35 other ‘tidal constituents’ would need to be considered for even a simple forecast. These relate to effects like:
The elliptical (not perfectly circular) orbit of the moon (N2) - causes apogean and perigean spring tides
The fact that the moon is not directly above the equator, and that this declination varies through its orbit (K1 and O1) - leads to big tides at the equinox
The tilt of the earth relative to the sun, leading to seasonal variations in the tide (Sa, Ssa)
The effects of shallow water on the movement of the tide (M4, M6, M8, S4)
Collection of data over extended time periods has made the prediction of the tide extremely accurate well into the future (i.e. years ahead) at important locations like major ports.
3.1.3 Meteorological effects
Not all tidal effects are driven by the sun and moon. The weather may have an effect too:
The height of the tide is affected by air pressure - a phenomenon known as the “inverted barometer effect”. Water levels are higher when air pressure is low and lower when air pressure is high. As a rule of thumb, the change is water level is around 1 cm per 1 hPa / 1 milibar pressure. The sea responds to atmospheric pressure over a large area, so changes in sea level due to air pressure rarely exceed 30 cm.
A strong onshore wind will tend to pile up water at the coastline, resulting in increased water levels - this effect is called ‘wind setup’. An offshore wind will do the opposite. Winds blowing along the coast may raise the sea level at high tide and depress it at low tide, increasing the tidal range. Winds blowing in one direction may also increase the length of time that a tidal stream flows in that direction.
Strong low pressure systems often bring strong westerly winds to the British Isles. As a result, the inverted barometer effect and wind setup often occur together. The resulting elevated sea level is called a ‘storm surge’.
3.2 Rise and fall of tides
3.2.1 Tide tables
The tide at ports is of significant interest to mariners and data exists on the height of tide going back many years. For example, data at https://www.bodc.ac.uk gives records of the tide at Newlyn in Cornwall going back to 1915. This data enables very accurate forecasts to be made of the times of high and low water at these locations, known as ‘standard ports’. Times of high and low water for standard ports are given in tide tables.
Tide tables are easy to use, but often report times in Greenwich Mean Time (GMT). During summer, when British Summer Time (BST) is in operation, an hour needs to be added to give the correct time. Some tide tables are given with the corrections for BST already applied - so always check if you’re using an unfamiliar tide table!
Tide tables are available from many sources. I find that the most useful are:
- The National Tide and Sea Level Facility: Accurate data for all major UK ports for the next 28 days.
- Easytide: UKHO site giving predictions 7 days ahead for practically anywhere in the world.
- Visit My Harbour: An impressive array of free tide tables for the whole of the current year.
Tide tables can, of course, be purchased in printed form. They also appear in nautical almanacs that are republished each year. I find it useful to obtain a copy of Reeds Small Craft Almanac each year so that I’m not reliant on an internet connection when I’m doing tidal planning.
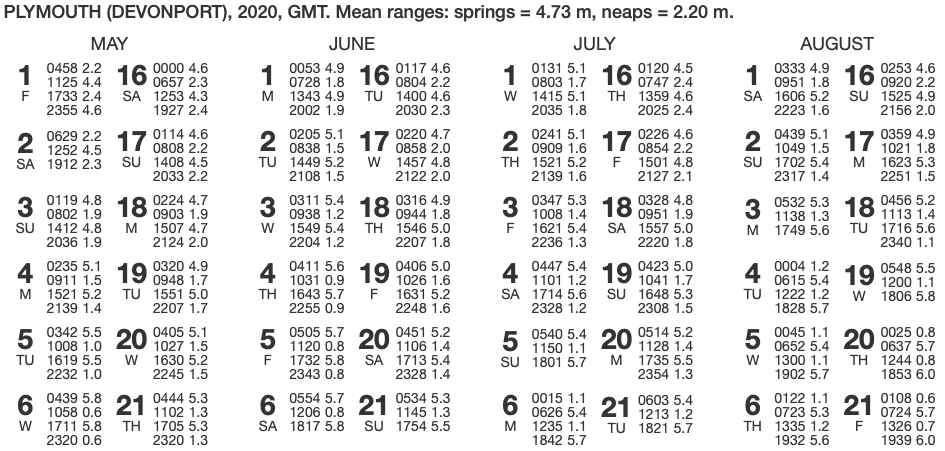
Find times of high and low water during the day at Plymouth on June 4th 2020. Also, find the tidal range.
Consult the tide table for Plymouth above. Note that times are given in GMT. Find the entry for June 4.
Big values of tidal height (5.6 m, 5.7 m) must refer to high water (HW). Low values (0.9, 0.9) refer to low water. So, during the day, the times are:
10:31 GMT   0.9 m Low water
16:43 GMT   5.7 m   High water
(we’re ignoring the early morning high tide and the late night low tide)
Being June, British Summer Time (BST) is in operation. To convert to BST, we must add one hour to the times given:
11:31 BST   0.9 m Low water
17:43 BST   5.7 m   High water
The tidal range is the difference in height of tide between high and low water: 5.7 - 0.9 = 4.8 m.
To plan paddles in areas affected by tides, we’ll likely need additional information not in tide tables - for example from guide books, charts and nautical almanacs. We’ll look at how to use this information in subsequent sections of these notes.
3.2.2 Tidal range
The tidal range is simply the difference in the height of the tide between high water and low water. Some parts of the world have a small tidal range - like the South Devon and Dorset coasts (up to 3m), whilst others have large ranges, like the Bristol channel (up to 14.4 m). In general, you’ll need to pay more attention to planning for the tides in areas with larger tidal ranges.
It is often useful to know whether the tide is a spring tide, a neap tide or somewhere in between.
Simply inspecting the tide table can give some information - spring tides will be associated with higher high waters and lower low waters. Some tide tables will indicate the days on which spring or neap tides occur.
3.2.3 Tidal factor
I find it useful to calculate a tidal factor – the ratio of today’s tidal range to the typical tidal range for a spring tide. This will be 1 (or 100%) for a typical spring tide and about 0.5 (or 50%) for a typical neap tide. Calculating this is straightforward, but a calculator can be handy:
Factor = tidal range today / tidal range at mean springs
For example, if the tidal range today is 6 meters and the tidal range at mean springs is 8.3 meters, then the factor is 6/8.3 = 0.72 = 72%
Data on the tidal ranges at mean springs can be found:
- In the back of Pesda Press’s sea kayak guidebooks.
- At https://www.ntslf.org (under ’highest & lowest predicted tides) - you’ll need to subtract mean low water springs from mean high water springs to get the mean spring range
- In any nautical almanac (e.g. The Reeds Small Craft Almanac)
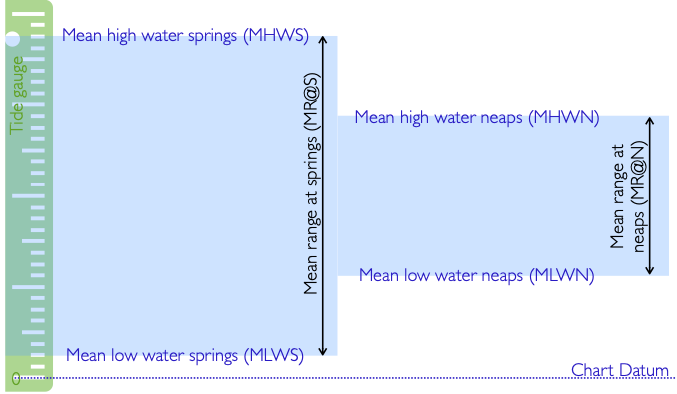
For example, the mean tidal ranges at springs and neaps are given at the top of the tide table below:
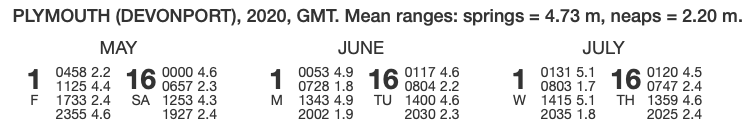
What is the tidal factor on June 1st 2020?
On June 1st, we have the following tidal data for Plymouth (adding an hour for BST):
08:28 BST Low water 1.8 metres
14:43 BST High water 4.9 metres
The tidal range on July 4th is 4.9-1.8 = 3.1 metres.
The mean range at springs for Plymouth is 4.73 metres. So the tidal factor is 3.1/4.73 = 0.66 = 66%.
The tidal factor is 66%, which is part way between neaps (50%) and spring (100%), but closer to neaps than springs.
3.2.4 Predicting high and low water away from standard ports
We saw in the last section how to use a tide table.
Such detailed data is not available everywhere that we would wish to paddle. To overcome this problem, reference books quote tidal constants for other locations. These are either added or subtracted to times of high and low water at standard ports to give local high and low water times. For example, this extract from a paddling guidebook tells us when HW and LW will occur at a location in the Isles of Scilly.
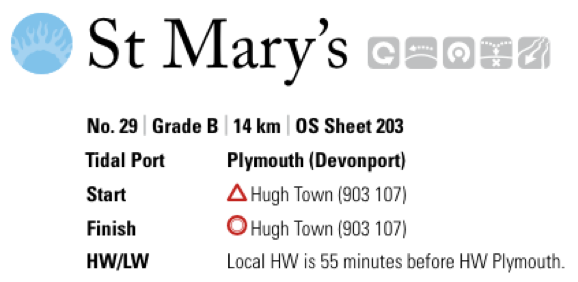
Find times of high and low water at St. Mary’s during the day on June 1st 2020.
Using the tide table, we can find the times of high and low water at Plymouth - ignoring the high water in early morning, and the low water late at night and remembering to add an hour for British Summer Time:
08:28 BST High water Plymouth
14:43 BST Low water Plymouth
We are told that HW and LW occur 55 minutes earlier than they do at Plymouth. Subtracting 55 minutes from the Plymouth times gives:
07:33 BST   HW ST MARYS
13:48 BST   LW ST MARYS
3.2.5 Estimating the depth of the tide
So, we can find out the times and heights of high and low water. But what if we are interested in the height of tide at a different time in the tidal cycle?
Skippers of yachts and captains of big ships are very interested in accurate predictions of the depth of the tide, and use tidal curves from nautical almanacs to get a precise answer. Sea kayakers rarely need such precision - but it’s helpful to remember that the tide rise (or falls) slowly in the first and last hours after/before high/low water, and rises/falls quickly in the middle hours between high and low water.
The rule of twelfths gives us a little more precision:
The tide rises (or falls):
1 twelfth of it’s range in the first hour after high/low water
2 twelfths in the second hour
3 twelfths in the third hour
3 twelfths in the fourth hour
2 twelfths in the fifth hour
1 twelfths in the sixth (final) hour
To make this a bit more real, let’s consider a slightly contrived example. Imagine a harbor that has 12 steps up the harbor wall:
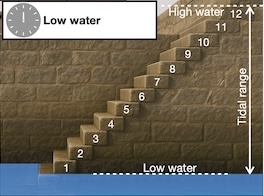
Low water today is at 12:00, and at low water, the water level is at the bottom of the first step. It just so happens that high water today will be at the top of step 12, 3.6 m higher. So, a twelfth of the tidal range is 3.6 m/12 = 0.3m = 30 cm = the height of one step.
Let’s see what happens after each subsequent hour.
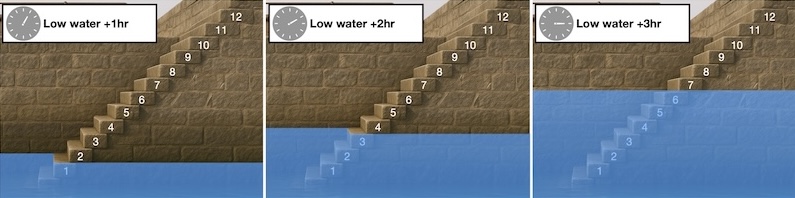
After the first hour, at 13:00, the tide has risen 1/12 of it’s range - one step.
In the second hour (14:00), it rises a further 2 steps (2/12 of the range) to the top of step 3.
In the third hour to 15:00, the tide rises 3 steps (3/12 of the range) more, to the top of step 6.
After the fourth hour, at 16:00, the tide rises 3 steps more to the top of step 9
After the fifth hour, at 17:00, the tide rises 2 more steps to the top of step 11
After the sixth hour, at 18:00, it is high water, and the water has risen a further 1 step to reach the top of step 12
Let’s look at a more practical example.
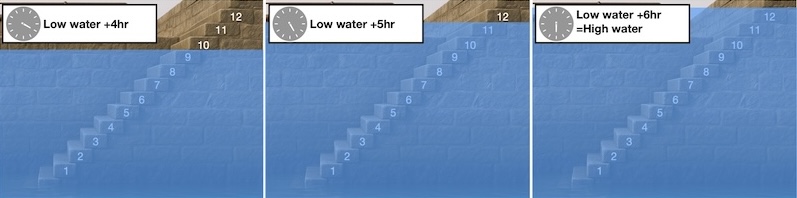
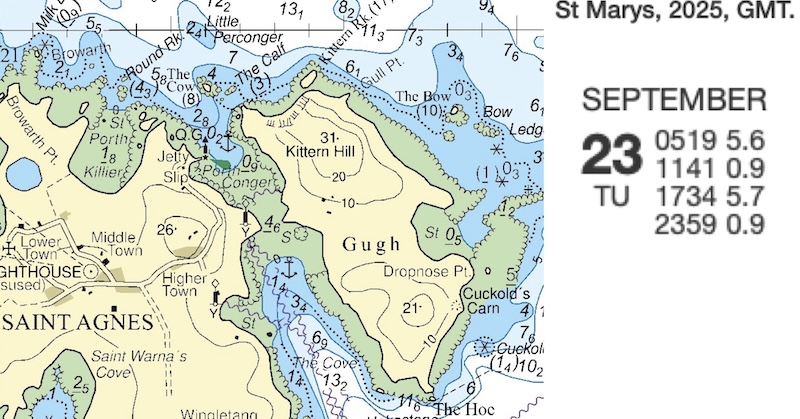
You would like to paddle the drying channel between Saint Agnes and Gugh on the afternoon of September 23rd 2025. At what time will the channel be underwater?
St. Mary’s harbor is very close to Gugh, so we can use the St. Mary’s times and heights without adjustment. We see that on the afternoon of the 23rd September, the low water height in 0.9 m and the high water height is 5.7 m, so that the tidal range is 5.7-0.9=4.8 m.
As we will be using the rule of twelfths, we will need to calculate 1/12 of 4.8m=0.4m
It is clear that the channel will only cover near the top of the tide, so we use times from high water. We note that the tide table is in GMT and 23rd September is in British Summer Time, so we must add one hour, giving a high water time of 18:34 BST, so:
At 18:34, the height of tide is 5.7 m (from tide table)
At 17:34, the height of tide is 1/12 of the range lower = 5.7-0.4= 5.3 m
At 16:34, the tide is 2/12 lower again = 5.3-2X0.4= 4.5 m
So, we expect the sandbar across the channel to cover just after 16:34, and be well covered by 17:34.
3.2.6 Using apps
Whilst it’s useful to know how to calculate high and low water times at a secondary port and good to have an appreciation of how the tidal height varies, in practice, I rarely use this information. The reason is that I can find more accurate information more quickly by using apps and online sources. I use:
The Admiralty Easytide website. This gives tidal predictions for today and the next 6 days including tide heights every half hour for many locations around the UK
Imray’s Tides Planner app provides tidal information for over 8,000 locations across the world, with height predictions for every 5 minutes. It also includes tidal stream data. You need to pay a small annual fee for access to the data.
You would like to paddle the 4.6m drying channel between Saint Agnes and Gugh on the afternoon of September 23rd 2025. At what time will the channel be underwater?
We use Imray’s Tides Planner app, set to September 23rd 2025:
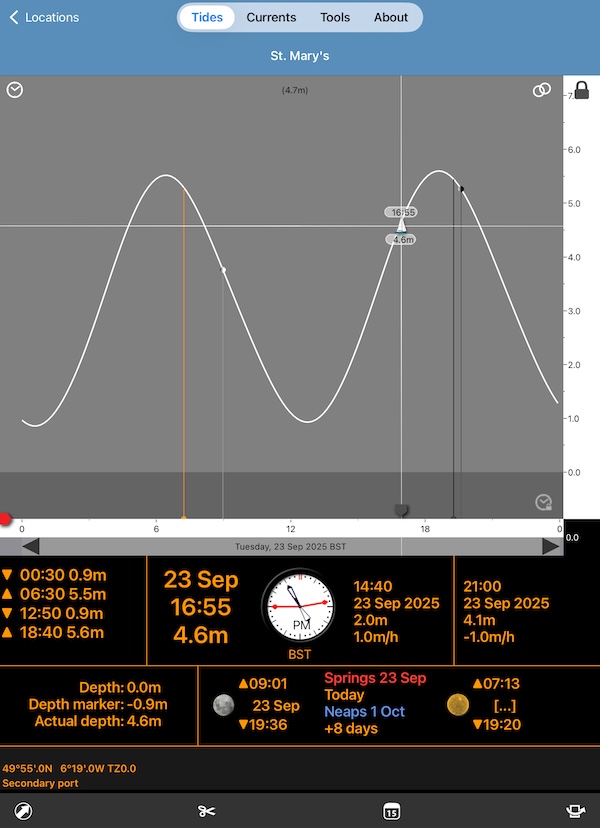
The screen shows lots of useful information in the bottom panels. To the left are the times of high and low water, corrects to BST. We can immediately see that it’s a spring tide.
The top panel shows a plot of the tide height across the day. I’ve dragged the little boat symbol to the point in the afternoon where the depth reaches 4.6m. The time can be read off as 16:55.
Notice that this process is a lot quicker than using tide tables and the rule of twelfths and more accurate. If we were looking at an area away from a standard port, the advantages are more significant as we wouldn’t need to go through the complicated process of correcting both time and tidal heights to the location of interest (these manual calculations are beyond the scope of these notes).
3.3 Introducing Tidal streams
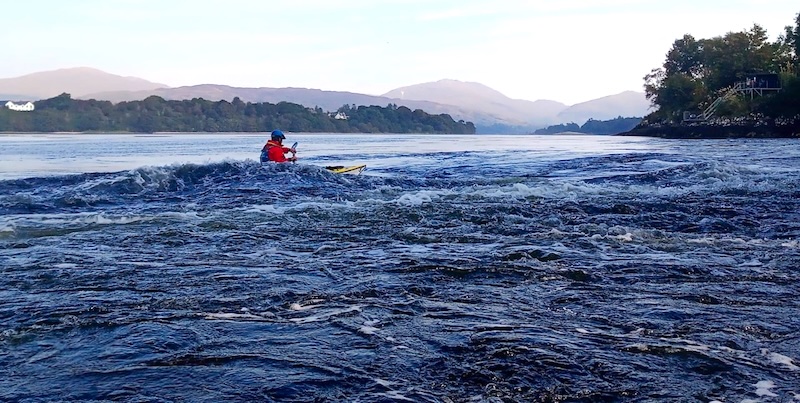
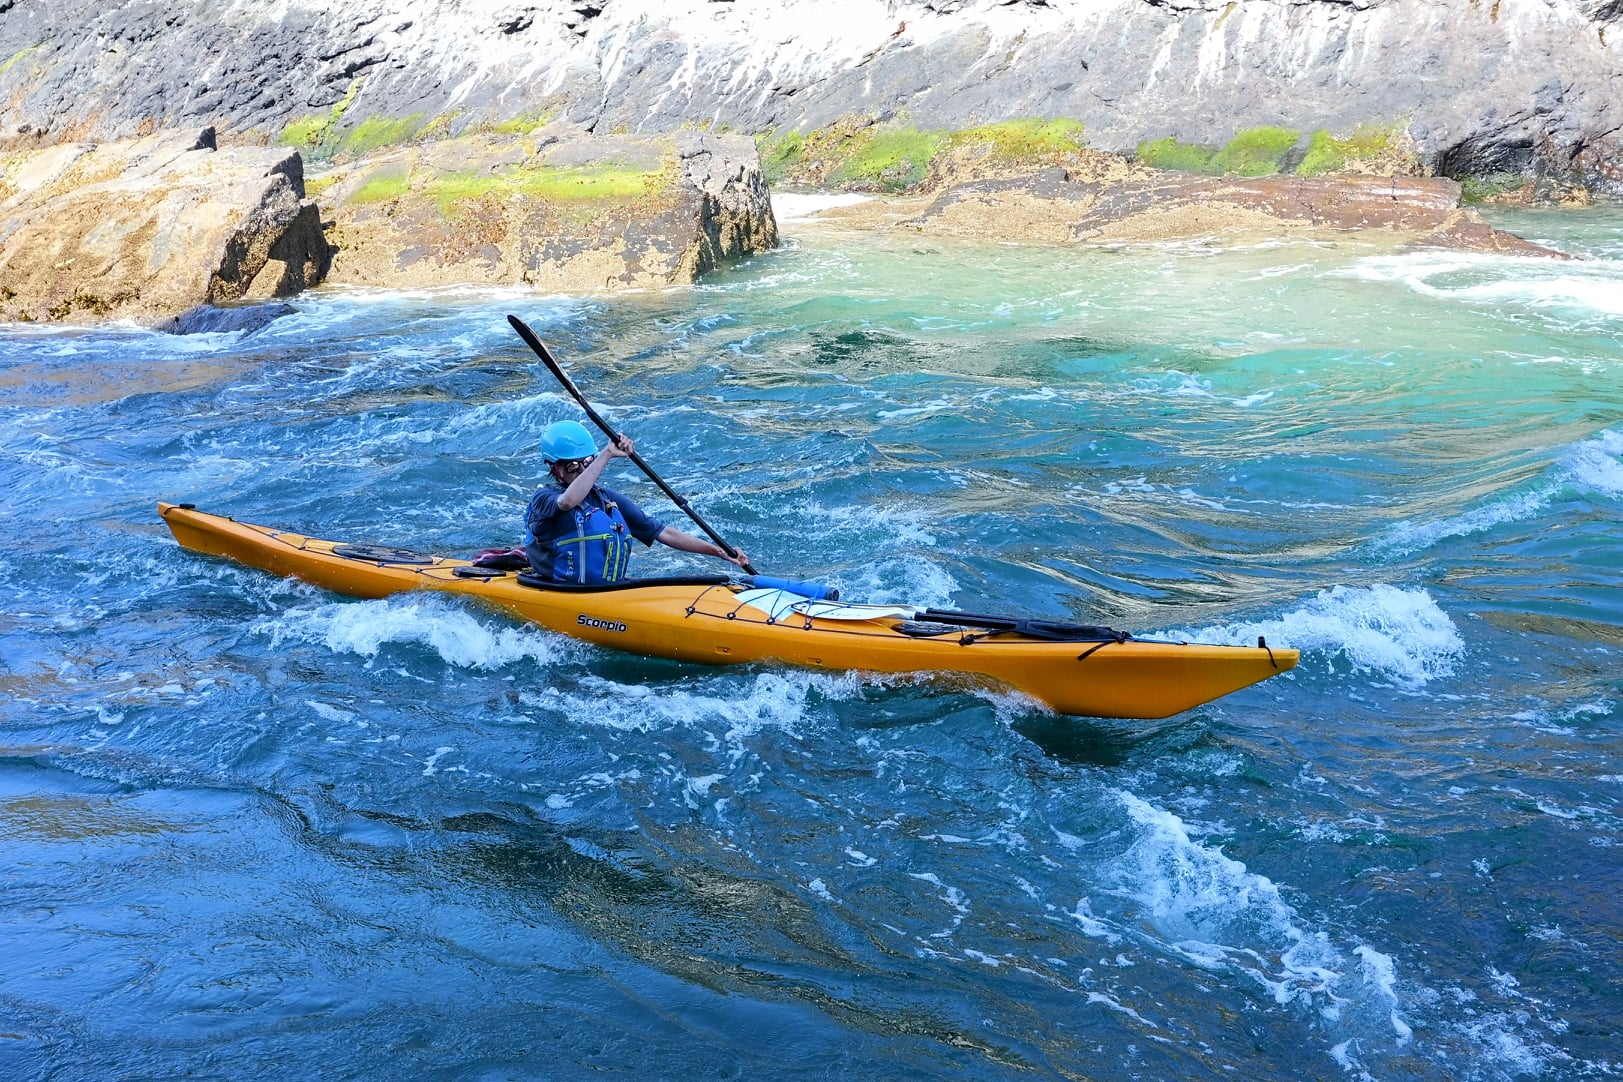
In order for the tide to rise and fall at a given location, water must move from one place to another. These horizontal movements of water are known as tidal streams. Online sea kayaking has a great video showing a few examples of kayakers paddling in strong tidal streams.
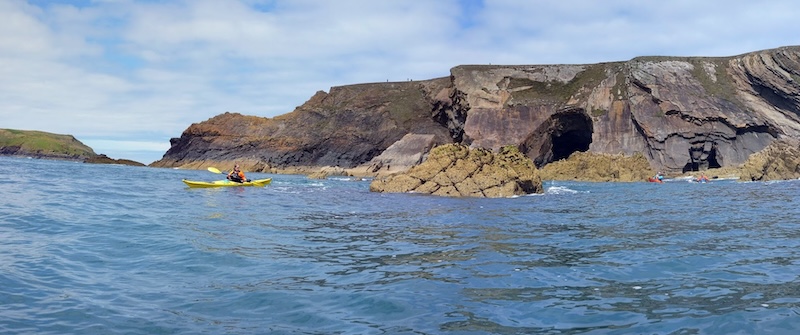
In many areas frequented by sea kayakers, steep rocky coastlines make the height of tide less of a concern. However, tidal streams often run at 2-3 kt and sometimes much faster. Given that tidal streams can move as fast as we can paddle, they clearly need to be accounted for in our plans.
3.3.1 Behaviour of tidal streams
How do tidal streams behave - and how is this behavior affected near the coastline? We’ll begin by taking a look at how tidal streams flow around the UK, then zoom in progressively to look at how the coastline’s features might affect the streams in a smaller area.
This map below shows the directions of the main flood tidal streams (i.e. those that occur in the run up to high water at Dover and Liverpool) around the UK. The tidal streams run in the opposite direction during the ‘Ebb’.
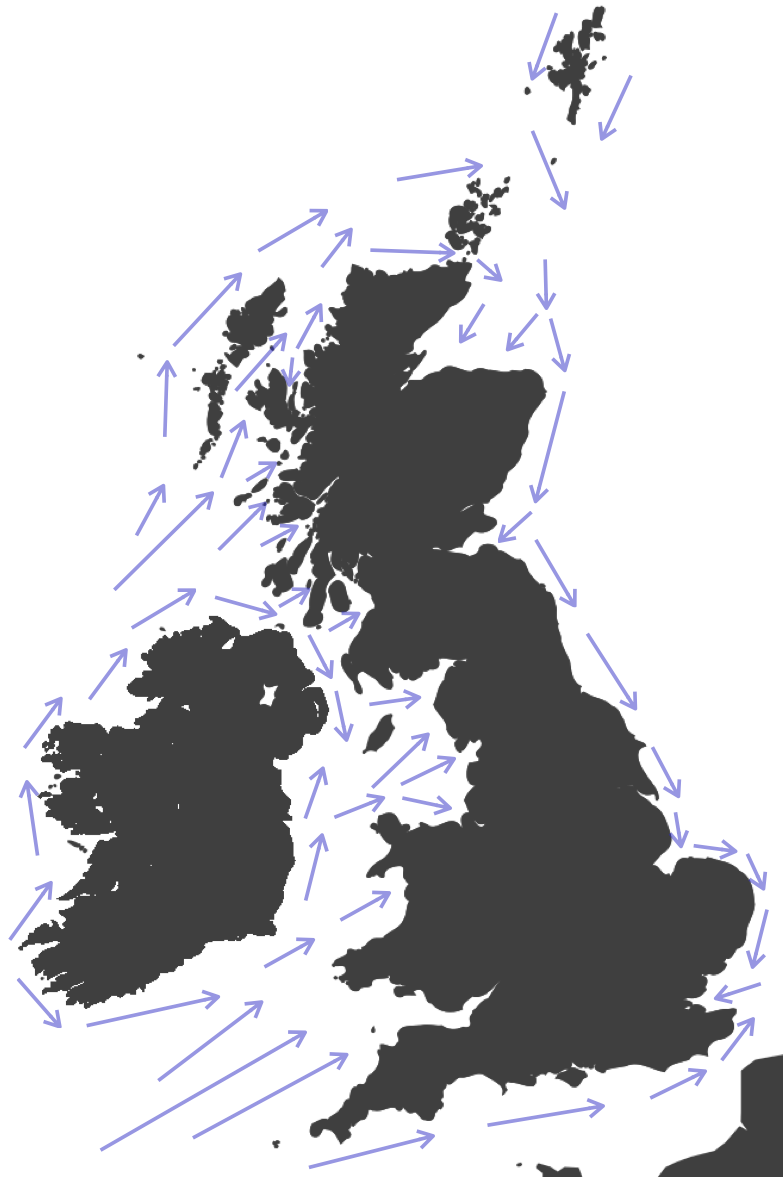
Tidal streams vary in strength according to the shape of the coastline and the seabed topography. With practice, it is possible to guess where the strong streams will occur and where the streams will be less strong, or eddies will form.
Flow tends to be weak close to the shore and stronger offshore. Flow at headlands that project into the tidal stream and squeeze it can be strong. Especially strong flows can occur in narrow channels between islands.
The flow of tidal streams is similar to that of a river, but on a much larger scale. Tidal flows tend to go in straight lines over long distances, taking lots of space to turn corners. An abrupt corner in a coastline will hence usually have an eddy behind it, where the flow is weak and may even be in the opposite direction to the main stream.
Anglesey sits at the north west corner of Wales. The tidal flow is concentrated here, as the water rushes around this corner towards Liverpool.
Looking at Anglesey with a flood tide, it should be no surprise that the fastest flows are found at the major headlands on the N and NW side of the island and in the narrow part of the straits that separate the island from Wales.

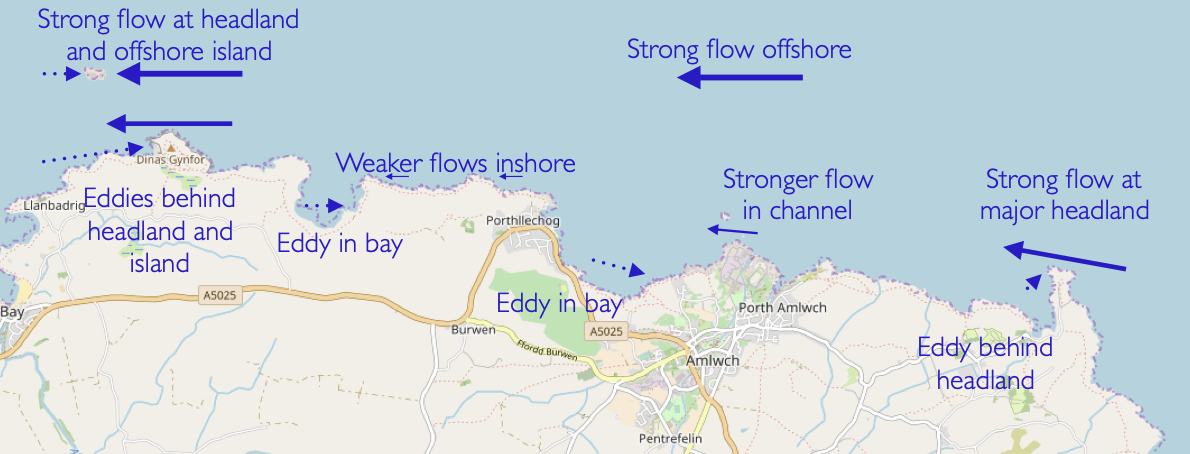
Zooming in further, the map below show some of the local tidal stream effects that occur on the North Coast of Anglesey when the flow is running toward the west:
3.3.2 Races and overfalls
If the tidal stream is squeezed into a smaller channel, it will speed up. This can occur in two ways:
The tidal stream can be squeezed sideways - perhaps into a narrow channel between islands, or by a headland protruding from the coastline:
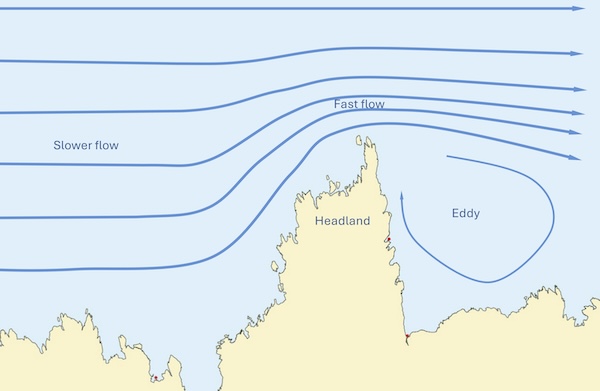
The area of fast flowing water here is known as a tide race.
The tidal stream might be squeezed vertically by an area of shallow seabed, or a reef:
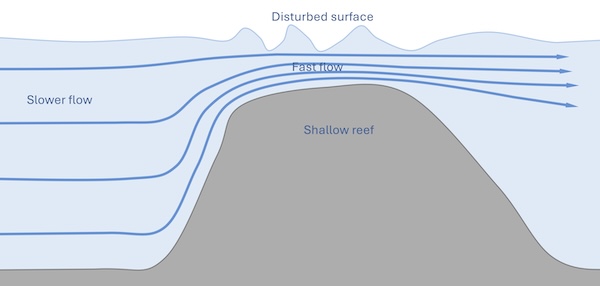
In this case, the area of fast flowing water is called an overfall.
Identify races and overfalls in the area around Bardsey Sound
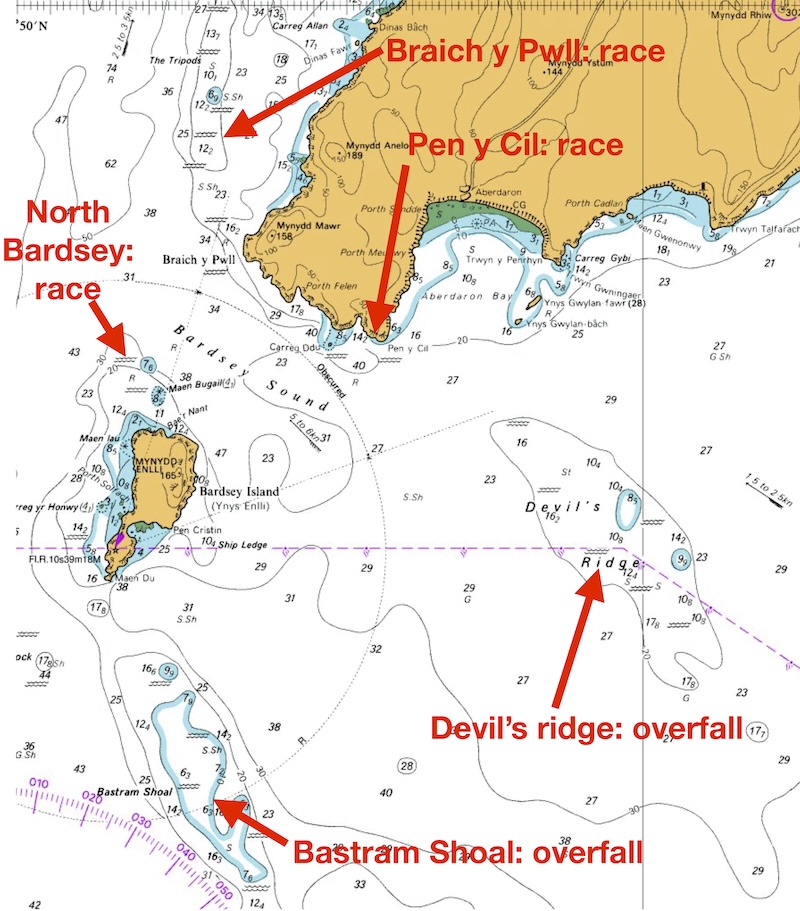
Bardsey sound is at the tip of the Lleyn Penninsula, a long finger of land sticking out into the sea. We shouldn’t be surprised that the tidal streams are strong at the end of such a big headland.
The chart makes it easy to see where major races and overfalls occur - they’re marked with wiggly lines that look like waves.
Two areas of shallows where overfalls form are marked: The Devil’s Ride and the Bastram Shoal. The tide speeds up over these shallow reefs, often causing a confused sea state.
There are a number of races marked around Bardsey sound where land squeezes the tidal stream - at the north end of Bardsey, at Pen y Cil and at Braich y Pwll. Notice how long the race at Braich y Pwll is - as the fast-flowing tide leaves Bardsey Sound and runs north, it takes a long time to slow down.
Note that it’s unlikely that all the races and overfalls that might affect a sea kayak are marked on a chart. For example, a challenging tide race can form at Maen Du at the sound end of Bardsey Sound. Although there’s nothing marked here, we might reasonably expect a race to form at such a sharp point given how fast the tide flows in this area.
In practise, there’s not a lot of difference between races and overfalls - many headlands have shallow areas extending out the sea, so that the tide is squeezed by horizontally and vertically. Many paddlers will use the terms ‘race’ and ‘overfall’ interchangeably.
Races and overfalls present a number of hazards to kayakers:
The boundary between the fast flow and adjacent slow flowing eddies can form a sharp ‘eddyline’ that can spin and capsize the inexperienced.
Turbulence as the flow accelerates, and especially as it decelerates, can form steep waves and boils.
When waves and wind move in the opposite direction to a tidal stream, larger and steeper waves will form - more on this in the notes on waves.
Of course, those with appropriate skills and experience often seek out these conditions for training and enjoyment!
The Falls of Lora is a tidal overfall that forms at the narrow entrance to Loch Etive (so, in some sense, it’s also a race). The image below shows the Falls during the flood tide:
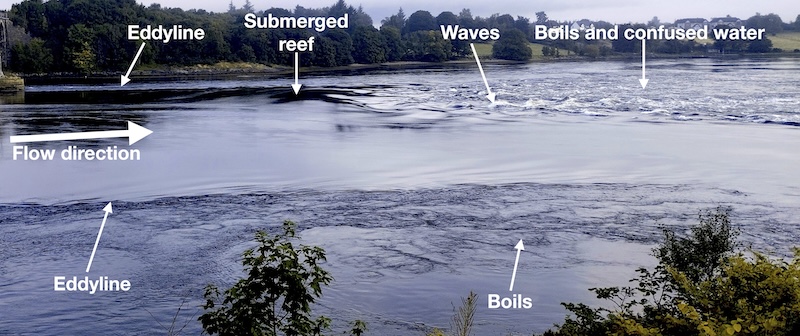
This overfall forms in sheltered wave, so it is rarely affected by sea state - the features are simply due to the fast flowing water.
Notice that the flow is smooth in the area where it is accelerating - all of the turbulence occurs down tide of the reef where the water is losing energy and slowing down.
It’s hard to get a sense of scale from the image - it’s likely that the largest waves in this image are a little over a meter high.
3.3.3 Signs of tidal flow
In tidal waters, it is important to understand what the tide is doing. With experience, it is possible to perceive tidal flow, perhaps by the ripples that a flow creates, or by the interaction of the tide with wind and swell. In an area of variable tide, the wind will tend to pick out areas where the tide is flowing against it with small waves, whereas regions of opposite flow can appear flat.

Tethered buoys and moored boats provide ways to assess tidal stream.
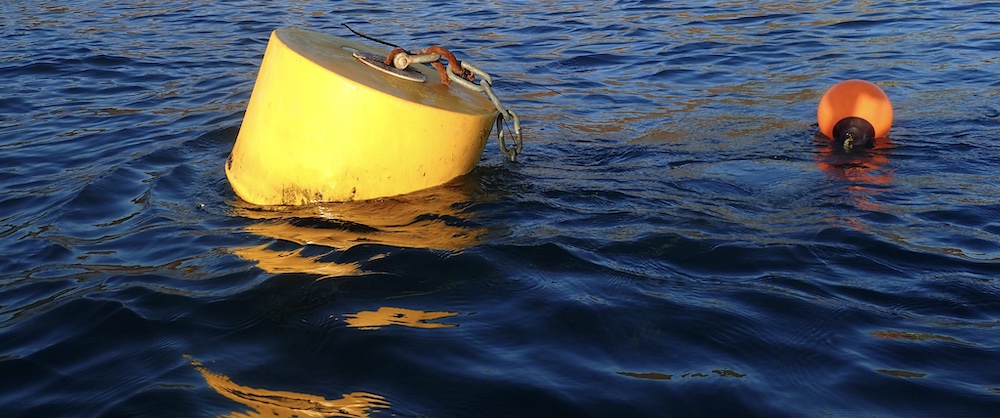
Of course, the tidal stream is often obvious from noticing which way our boats drift when we stop paddling. Transits can be used to judge this when the stream is slower.
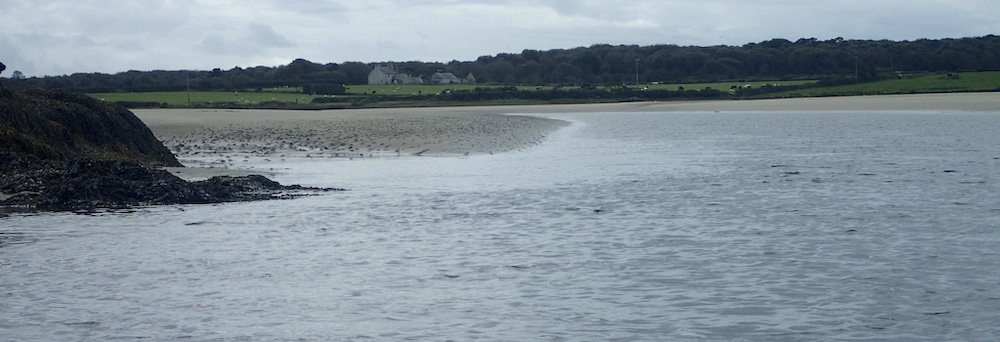
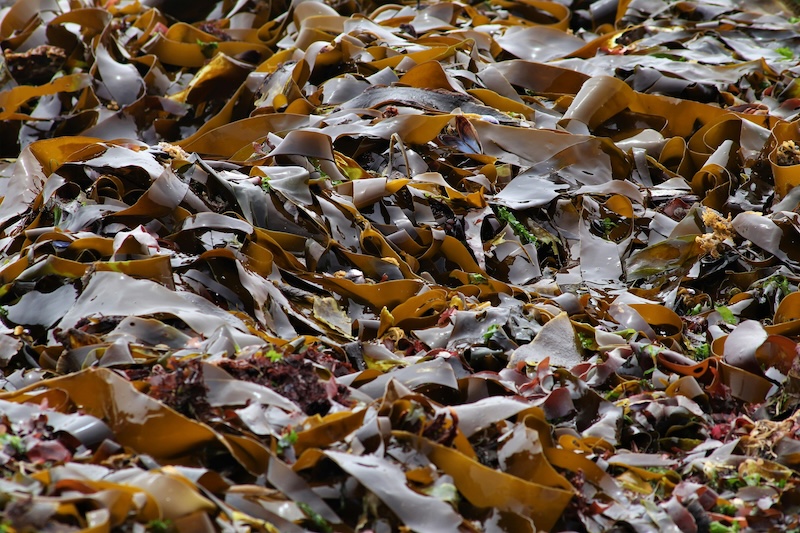
Environmental cues can also tell us something about the height of tide:
3.3.4 Predicting tidal streams
Unfortunately, tidal streams do not necessarily change direction at high and low water, so we need to find information on when they turn for the location at which we want to paddle. A range of information sources about tidal streams exist. The main sources are:
- Tidal diamonds (and the associated tables) on charts
- Tidal stream atlases
- Pilots and guidebooks
These sources will give the time that the tide changes relative to some reference port. Note that the reference port used may be some distance from the location - e.g. Dover is used as a reference port by some sources for tidal streams at Lands End.
Each type of source presents the information in a different way, so we’ll consider them one by one in the sections that follow.
Once we’ve learned to predict tidal streams, it’s worth thinking about what we’ll do with the information. We may choose to arrive at areas with fast tidal flows (typically headlands or narrow straits):
At slack water to avoid the tidal flow to increase safety (or perhaps to remain within our leadership remit)
At full flow to maximize the benefit from the tidal stream, and to enjoy crashing through the race waves
As the tidal stream builds, so that we can gain confidence playing in the stream and stop when it gets too much for us.
As the tidal stream drops, so that if we don’t like the conditions, or can’t paddle against the stream, we know that things will improve in the coming hours.
You have predicted that the tidal streams around the Isle of Wight will flow east from 06:30 and 18:30 and west from 12:30. Flows will reach 3 knots in most places and over 4 knots in the narrows by Hurst Point.
Select appropriate timings for:
A crossing to the Isle of Wight from Hurst Point to Fort Albert
A trip to Horse Sand Fort from Gosport IRB station
A play session in the strong tidal flows at Hurst Point
A single day circumnavigation of the Isle of Wight from Hurst Point
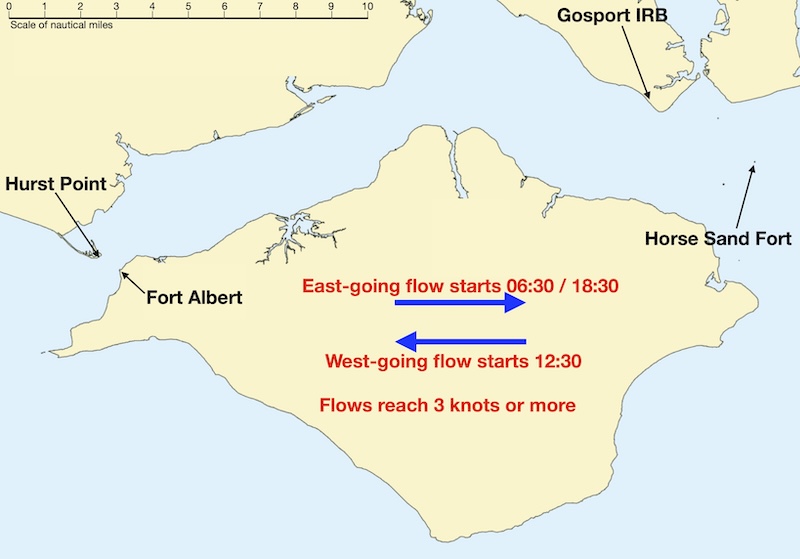
1) Crossing to the Isle of Wight from Hurst Point to Fort Albert
Given the strong tidal streams in the narrows between Hurst Point and Fort Albert, it will be easiest to do this crossing at slack water at 12:30.
2) A trip to Horse Sand Fort from Gosport IRB station
We will use the east-going tide to get to the offshore Fort and the west-going tide to return. We will need to be at the Fort when the west–going flow starts at 12:30. It’s about a 3 mile paddle from Gosport, so it should take an hour, perhaps a bit less with the help of the tidal stream. We’ll depart Gosport at 11:30, get to the Fort at 12:30 and return to Gosport for 13:30.
3) A play session in strong tidal flows at Hurst Point
We expect maximum flows half way between the times of slack water - for example at 15:30 in the afternoon. We might plan to arrive at Hurst Point before this time, perhaps at 13:30, and get used to the conditions as the tidal stream builds in strength.
4) A single day circumnavigation of the Isle of Wight from Hurst Point
One approach is to depart Hurst Point at around 05:30 to be at the western end of the Isle of Wight for 06:30 when the east-going tide starts to flow. We will need to be at the east end of the Isle of Wight by 12:30 when the west-going flow starts, requiring us to cover the ~24 nautical miles in 6 hours, averaging around 4 knots - which should be possible if we stay offshore in the strong tidal stream. We then have until 18:30 to paddle the 21 miles to Hurst Point along the north side of the Isle of Wight.
In practice, we would use tidal predictions for specific locations to make planning more accurate for any of these activities! However, the approach outlined here would be appropriate for making an initial outline plan before we started to work on the details.
3.4 Tidal stream atlases
The UKHO publishes a series of tidal stream atlases that cover the UK. Atlases for smaller areas are sometimes found on nautical charts. Atlases can be found from other sources (e.g. in Reeds Almanac), but these are normally from UKHO data. Excellent flow atlases are also found in some pilot books published by local yachtsman covering specific areas of popular coastline and going into great local detail.
Visit My Harbour is a great source, providing all the main UKHO tidal stream atlases for free.
A tidal stream atlas is a series of maps that show tidal flows at different times in a tidal cycle:
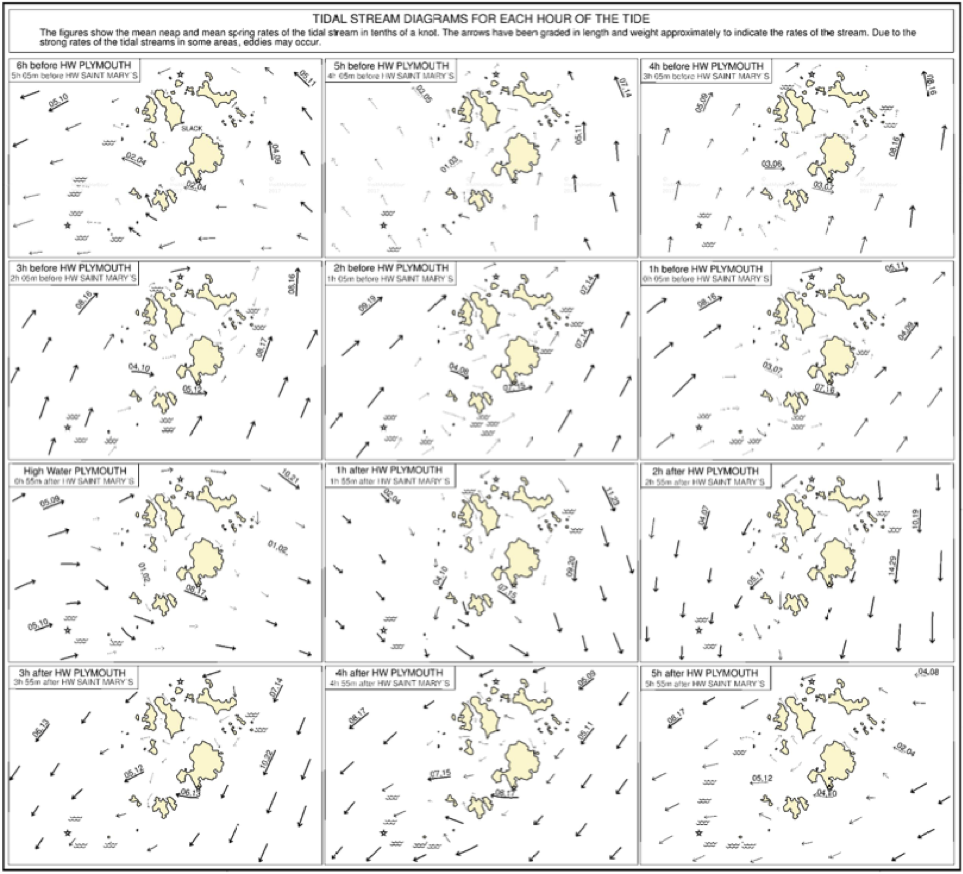
The thickness of arrows on an atlas gives an approximate indication of tidal speed. When numbers are shown, they are in tenths of a knot, with a comma separating flow speeds for springs and neaps.
Tidal stream atlases can be of limited use for inshore kayaking, although there are many areas where they are very useful – especially around island archipelagos like the Scillies, Orkney and the Channel Islands.
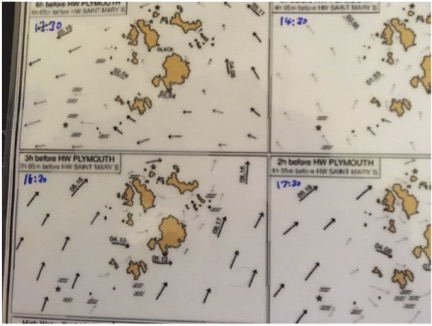
A good way to use an atlas is to mark it up with the timings for the day to get a feel for what the tide is going to do across the area, as shown below:
3.5 Pilots and guidebooks
Detailed tidal atlases are not available for all areas. Often, we must rely on less complete data given in narrative form from local experts. Such data can be found in sailing directions, books that are written to convey local knowledge to mariners. These are colloquially know as ‘pilots’. The UKHO publishes a range of pilots covering the UK in detail and the rest of the world in less detail. Other national agencies do the same. The information in these pilots is primarily intended for large ships, so yachtsman have produced their own pilots, often with more detailed information, for areas in which they cruise. These are often useful for kayakers.
Sea kayaking guidebooks include the most important tidal information from pilots and other sources. Being focused on kayaks, rather than large ships or yachts, they’re a great source of information in a compact format. Over the last few year, Pesda Press has published an excellent set of guidebooks covering most of the UK. For most kayakers, these books will be cheaper, more accessible and better than UKHO or yachting pilots.
All pilots use a similar format for describing tidal streams. In sea kayak pilots you will also see tidal stream data shown graphically on maps:
Pilot information is presented in a fairly understandable format. Its use is best illustrated by an example.
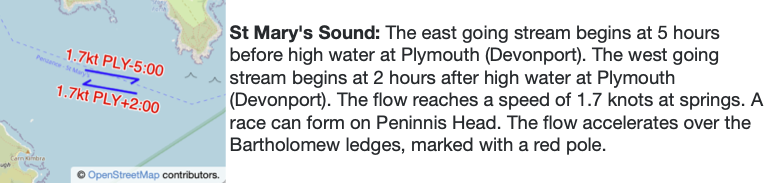
Describe the tidal flow in Saint Mary’s Sound on June 14th 2017 (HW Plymouth is at 09:29 BST and 21:44 BST)?
We already know that HW Plymouth is at 09:29 BST and 21:44 BST.
The ESE stream begins HW Plymouth -5:00
09:29 – 05:00 = 04:29 BST
21:44 – 05:00 = 16:44 BST


The WNW stream begins HW Plymouth +2:00
09:29 + 02:00 = 11:29 BST
21:44 + 02:00 = 23:44 BST
So, we expect the tide to run ESE in the morning (from 04:29), turning WNW at 11:29. It turns ESE again at 16:44, running in this direction until 23:44.
We can use the information from pilots, together with measurements of distance covered and estimates of paddling time to plan a day on the water. If we’re staying close to the coastline, it is normally best to assume our normal paddling speed (e.g. 3 knots) rather than expecting to be faster due to tidal assistance. If we’re planning to be further offshore, we may need to factor in the effects of tide on our speed - there’s more on how to do this in the sections below.
It’s July 1st 2020. It’s a fine day, with no wind. High water times at Liverpool are 08:18 and 20:56 BST. Plan a trip around the ‘Stacks’ - the trip between and Soldier’s Point and Porth Dafarch on Anglesey.
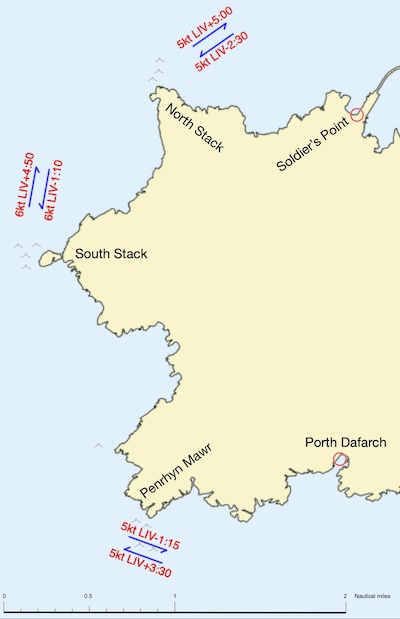
HW Liverpool (LIV on the pilot diagram) is 08:18 / 20:56.
Working through each of the major headlands:
Penrhyn Mawr: SE-going LIV -1:15 = 07:03 / 19:41 | W-going LIV +3:30 = 11:48
South Stack: S-going LIV -1:10 = 07:08 / 19:46 | N-going LIV +4:50 = 13:08
North Stack: W-going LIV -2:00 = 06:18 / 18:56 | ENE-going +5:00 = 13:18
We also measure the distances between these points and the start/finish points and estimate times to paddle between them. It is easiest to show this information on a sketch map:
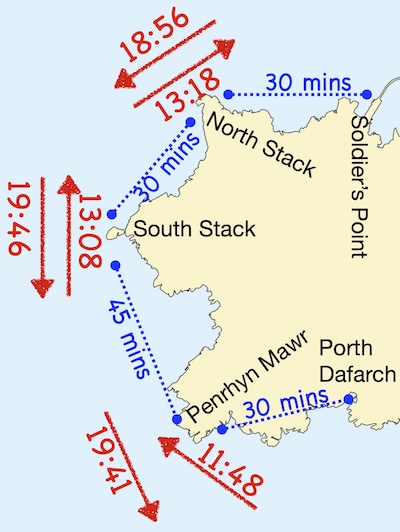
It looks easiest to go clockwise, from Porth Dafarch to Soldier’s Point. If we go the other direction, we need to get around Penrhyn Mawr by 11:48 when the tide turns north-west. This would mean starting at 10:00 - feasible, but that plan allows no contingency or time to explore.
If we want to get to Penrhyn Mawr at slack water, the earliest time we should depart Porth Dafarch is 11:15. We might then choose to have lunch in the bay to the north of Penrhyn Mawr, aiming to be back on the water and at South Stack for around 13:15 (slack water). We might then reach North stack at around 13:45 and Soldier’s Point at 14:15.
In practice, we might add more time to this plan to allow time to explore the coastline - but as long as we’re off the water before around 7pm, we will still be paddling with the tide.
3.5.1 Variation of flow between neaps and springs
We have focused so far on determining which way the tidal stream will be flowing and when. This is often enough to plan a simple sea kayak journey. However, it is sometimes useful to estimate the speed of the tide with greater precision.
Pilots and guidebooks will often only give a tidal stream speed for a (mean) spring tide. But what if today isn’t a spring tide?
We calculated a tidal factor earlier as the ratio between the actual tidal range and the range at mean springs. Given that the tidal range is what drives the tidal streams, we can simply multiply the factor by the flow speed at springs to estimate the speed that we will experience.
What will the maximum flow be in St. Mary’s Sound on 1 June 2020?
Consulting the Plymouth tide table….
The tidal range on June 1st is 4.9-1.8 = 3.1 meters. Given that the mean range at springs is 4.73m, the factor is 3.1/4.73 = 0.65 - i.e. between springs and neaps.
The pilot information above told us that the maximum flow speed in the Sound is 1.7 knots at springs.
We estimate the maximum flow on June 1st as 0.65 X 1.7 = 1.1 knots.
3.5.2 Variation of flow through the tidal cycle
Another problem with pilots is that they typically only provide data on when the direction of flow changes (slack water) and what the maximum flow is. We may wish to estimate flow at other times. Two rules of thumb exist to do this – the 50/90 rule and the rule of thirds.
3.5.2.1 50/90 rule
The 50/90 rule states that:
- We expect zero flow speed as the tidal stream changes direction (slack water)
- One hour later, the flow attains 50% of maximum speed
- Two hours after slack water, the flow attains 90% maximum speed
- Three hours after slack water, the flow speed is a maximum (100%)
- 90% at 4 hours
- 50% at 5 hours
- Slack water occurs again after 6 hours
It’s fairly obvious that the flow is zero at slack water and maximal 3 hours later. And it’s intuitive that the flow speed decreases in hour 4 and 5 the same way it increased in hours 1 and 2, so the main point to remember is:
50/90 rule: flow attains 50% of max speed after 1 hour, 90% after 2 hours
Let’s look at an example:
Estimate how the tide will vary in Saint Mary’s Sound on 1 June 2020
The pilot tells us:
St Mary’s Sound: The east going stream begins at 5 hours before high water at Plymouth (Devonport). The west going stream begins at 2 hours after high water at Plymouth (Devonport). The flow reaches a speed of 1.7 knots at springs.
Consulting the Plymouth tide table….
The tide times at Plymouth on June 1st are:
01:53 BST 4.9 m  HW
08:28 BST 1.8 m  LW
14:43 BST 4.9 m  HW
21:02 BST 1.9 m  LW
As we’ve previously calculated: the tidal range is 4.9 m - 1.8 m= 3.1 m, giving a factor of 3.1 m / 4.73 m = 0.65, so maximum flow on June 1st = 0.65 X 1.7 knots = 1.1 knots.
Looking now at the afternoon high water, and recalling the pilot tells us that “The east going stream begins at 5 hours before high water at Plymouth (Devonport). The west going stream begins at 2 hours after high water at Plymouth (Devonport)”:
14:43 BST 4.9 m  HW - 5 hrs = 09:43 : E going stream starts
14:43 BST 4.9 m  HW + 2 hrs = 16:43 : W going stream starts
So, the east going stream will begin at 14:43 -5:00 = 09:43 and run until the west-going stream starts at 14:43 +2:00 = 16:43. We use the 50/90 rule to estimate the flow speeds. Unfortunately, the flow here runs for 7 hours, so we modify the rule slightly with 2 hours of 100% flow rather than one:
| Time | Compared to slack water | 50/90 rule | Flow speed | Direction |
|---|---|---|---|---|
| 09:43 | 0 | 0% | 0 | - |
| 10:43 | +1 | 50% | 0.6 kt | E |
| 11:43 | +2 | 90% | 1.0 kt | E |
| 12:43 | +3 | 100% | 1.1 kt | E |
| 13:43 | +4 | 100% | 1.1 kt | E |
| 14:43 | +5 | 90% | 1.0 kt | E |
| 15:43 | +6 | 50% | 0.6 kt | E |
| 16:43 | 0 | 0% | 0 | - |
3.5.2.2 Rule of thirds
The rule of thirds is used to estimate average tidal flow speed during each hour. This makes it less useful in estimating flow at a given time, but more helpful if we are trying to estimate average speeds of paddling with tidal assistance (or hindrance). It states that:
- During the first hour after slack water, average flow is 1/3 of maximum
- During the second hour, average flow is 2/3 maximum
- During the third and fourth hours, average flow is equal to the maximum
- During the fifth hour, 2/3 maximum
- During the sixth hour, 1/3 maximum
Again, it’s fairly easy to remember that flow is at a maximum during the third and fourth hours and that the flow speed decreases in hour 5 and 6 the same way it increased in hours 1 and 2, so the main point to remember is:
Rule of thirds: the average flow is 1/3 of max speed in the first hour of the tide, 2/3 in the second hour
You are planning a trip from Bull Point to Lundy Island, a distance of about 17 miles, on May 27th 2025
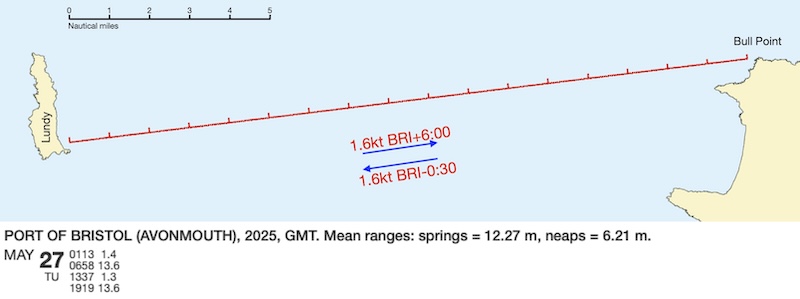
If you depart at the start of the ebb tide, when do you expect to arrive?
On May 27th, high water is 06:58 GMT. For simplicity, we’ll call this 07:00 GMT = 08:00 BST. This is our departure time from Bull Point.
The range is 13.6-1.3 = 12.3 m, which matches the spring range closely, so we will assume that we can use the spring tide flow rate of 1.6 knots directly.
We will assume that our group paddles at 3 knots in still water. So:
During the first hour, the flow is 1.6/3= 0.5 knots, so our total speed is 3+0.5=3.5 knots, and we will cover 3.5 miles by 09:00
During the second hour, the flow is 2X1.6/3=1.1 knots, so our total speed is 3+1.1=4.1 knots and we cover 4.1 miles. We’ve now covered 3.5+4.1 =7.6 miles by 10:00
During the third hour, the flow is 1.6 knots, and our total speed is 4.6 knots, so we’ve covered a total of 12.2 miles by 11:00
During the fourth hour, the flow is 1.1 knots, total speed 4.1 knots, so we cover 16.3 miles by 12:00
During the fifth hour, the flow is 0.5 knots, total speed 3.5 knots, so we would expect to cover the remaining 0.7 miles in 0.2 hours = 12 minutes
So, we expect to arrive around 12:12 at Lundy (this is overly exact - perhaps we should say ‘12:15’). In reality the tidal streams will vary over this distance in ways that we don’t have information on.
3.6 Tidal diamonds
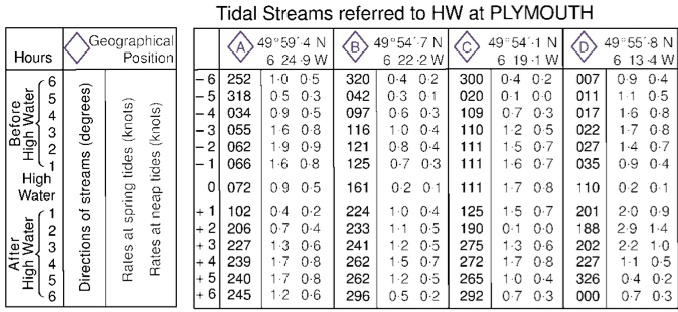
On charts, tidal information is given at specific points denoted by a purple diamond shape with a letter. A table, normally found at a corner of the chart, gives information on the tidal flow at each point.
The chart extracts below show Saint Mary’s Sound in the Scillies and the corresponding data table. The information is laid out in a fairly self-explanatory way:
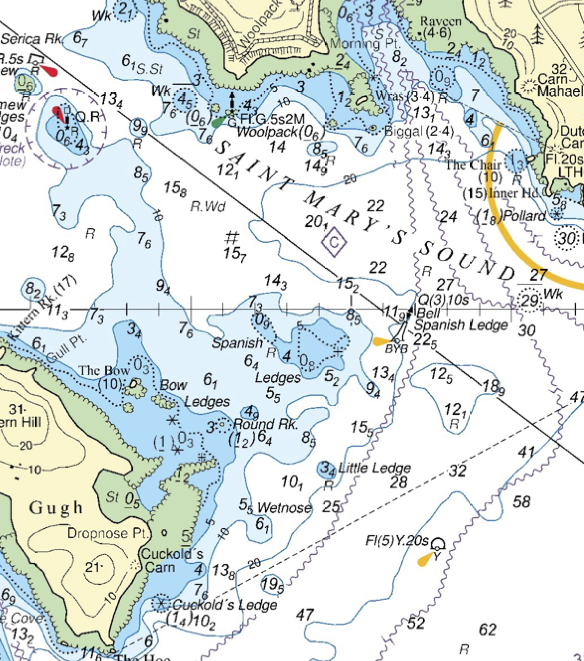
Describe the tidal flow in Saint Mary’s Sound on July 4th 2017? We notice that the tidal stream tables refer to high water at Plymouth. We must begin by consulting a Plymouth tide table:
On July 4th, we have the following times of high and low water, remembering to add the hour for British Summer time:
05:47 5.4 m High Water
12:01 1.2 m Low Water
18:14 5.6 m High Water
We note that the tidal range is 4.4 m, and the factor is 4.4/4.73 = 93%, which is close to springs. We will use the left hand column for diamond C which gives the rates at spring tides.
The table below shows data taken from tidal diamond C related to times on June 14. It has been created by entering the HW times for Plymouth on the ‘0’ row then counting backward and forward up and down the table:
| Time relative to HW | Bearing | Time of day | Rate | Comment |
|---|---|---|---|---|
| -6 | 300 | 12:14 | 0.4 kt | |
| -5 | 20 | 13:14 | 0.1 kt | Tide is turning to the east |
| -4 | 109 | 14:14 | 0.7 kt | |
| -3 | 110 | 15:14 | 1.2 kt | |
| -2 | 111 | 16:14 | 1.5 kt | |
| -1 | 111 | 17:14 | 1.6 kt | |
| 0 | 111 | 05:47 , 18:14 | 1.7 kt | Tide runs at maximum speed east |
| +1 | 125 | 06:47 | 1.5 kt | |
| +2 | 190 | 07:47 | 0.1 kt | Tide is turning to the west |
| +3 | 275 | 08:47 | 1.3 kt | |
| +4 | 272 | 09:47 | 1.7 kt | Tide runs west at maximum rate |
| +5 | 265 | 10:47 | 1.0 kt | |
| +6 | 292 | 11:47 | 0.7 kt |
So, the tide starts flowing west a little after 07:47 in the morning. At around 09:47, it reaches a maximum speed in the westward direction of 1.7 knots. The speed drops until around 13:14, when the tide swings to the north, before starting to run east. It reaches the maximum speed eastward of 1.7 knots at around 18:14 in the evening.
Note the approximate times given – we only have data at each hour, so we can only estimate the times of slack water and maximum flow.
3.6.1 Interpolation
What if want to estimate the tidal stream from a tidal diamond for a day when it isn’t neaps or springs?
The method of interpolation uses both the springs and neaps flow speeds and associated tidal ranges to calculate flow speed at an intermediate tidal range. It is normally done using a plot found on the inside cover of a tidal stream atlas:
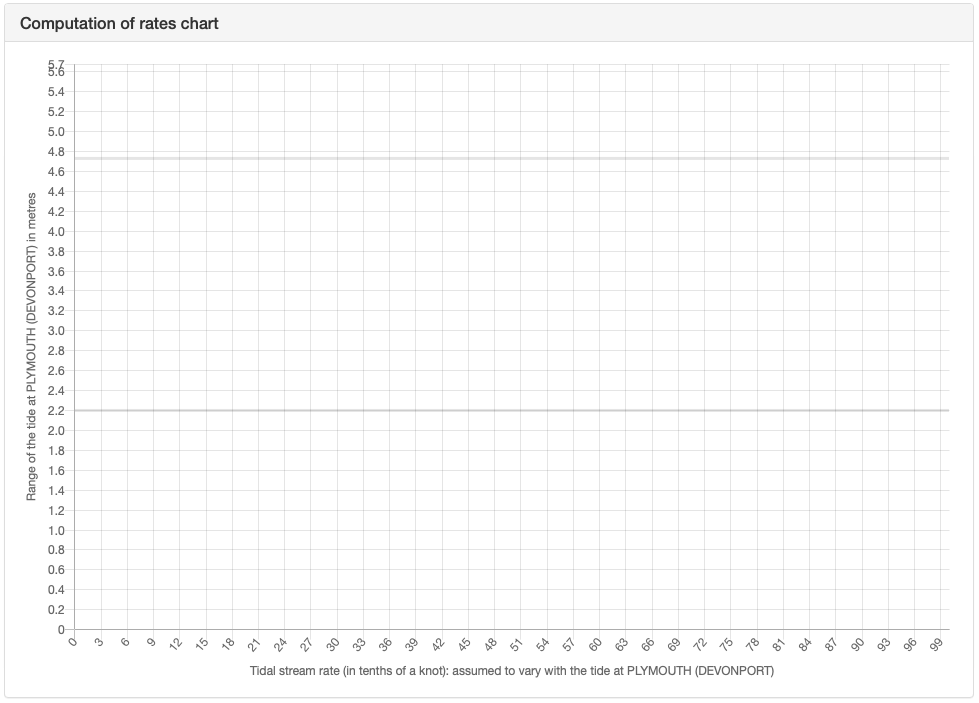
Tidal stream flows for both springs and neaps are plotted on this diagram against the corresponding tidal ranges – mean springs and neaps ranges being shown on the diagram. A straight line is drawn between these two points. This line can be used to calculate a speed for any given tidal range.
Interpolation can also be done by the mathematically minded using an equation.
The equation is:
\[ speed@neaps+\left(speed@springs-speed@neaps\right)\frac{range-range@neaps}{range@springs-range@neaps} \]
Using this is not straightforward and can be prone to errors, so the calculation is more commonly done graphically
An example will help to explain how the interpolation process works in practise:
Estimate the fastest speed of tidal flow in Saint Mary’s Sound on 1 June 2020?
We previously consulted a tidal diamond and found that maximum flow occurs at HW Plymouth and 4 hours later and is 1.7 knots at springs, 0.8 knots at neaps.
We also know from the tide tables that:
range at mean springs = 4.73 m
range at mean neaps = 2.20 m
Note that these correspond to the position of the dotted lines on the computation of rates chart, as we would expect. The tidal range on June 1st is 3.1 m.
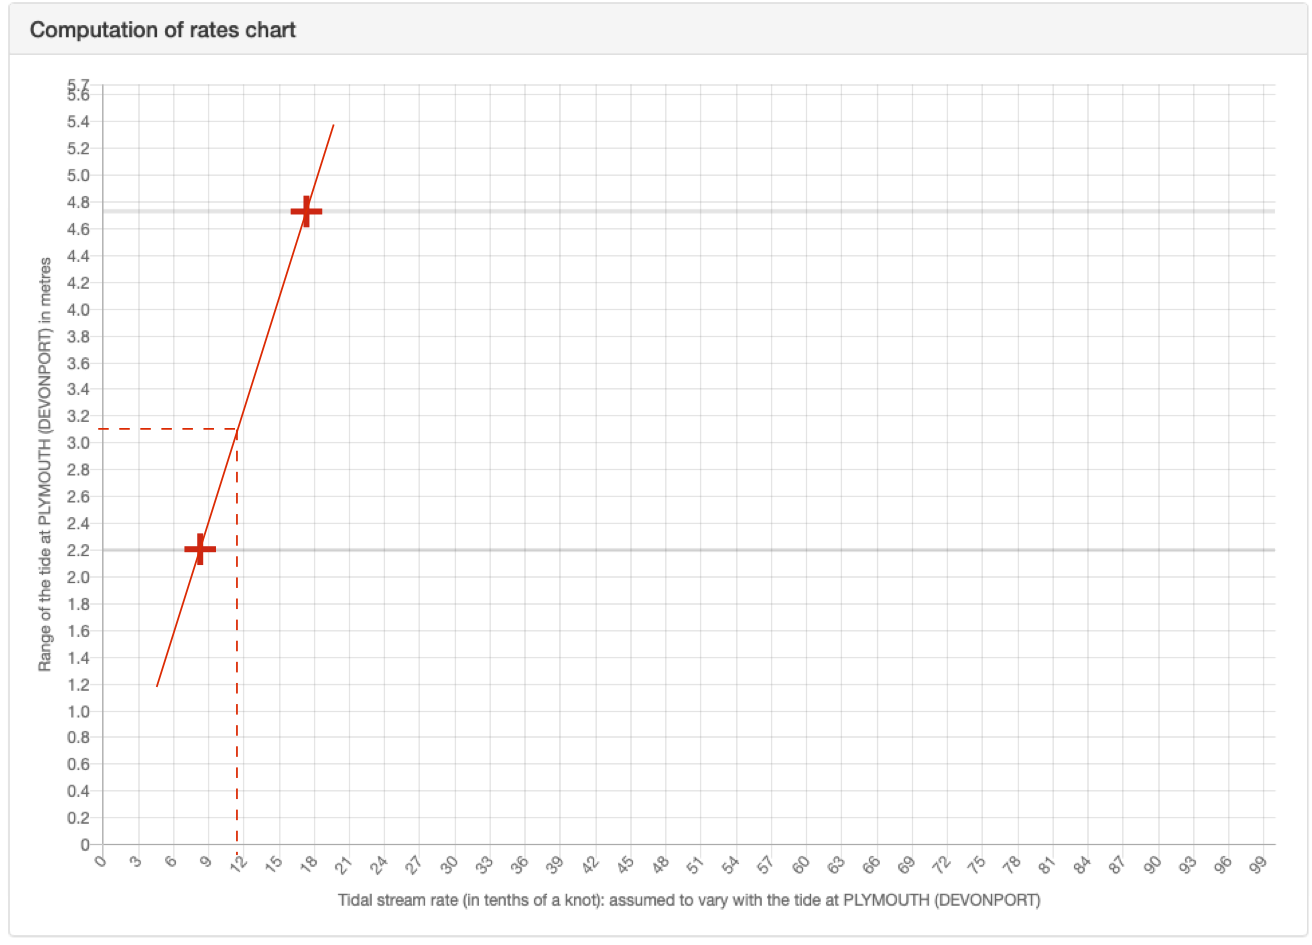
Mark the speed at springs (1.7 knots) on the upper grey horizontal line, (upper red cross). Similarly, mark the speed at neaps (0.8 knots) on the lower horizontal line (lower red cross).
Draw a straight line (non-dashed red line) between these two crosses.
Draw a horizontal line across from the tidal range on June 1st (3.1 m) (horizontal dashed red line). Where this meets the line drawn previously, draw a final line down vertically. This goes to around ‘11’, indicating 1.1 knots.
We can also also do the interpolation using the equation:
Speed = speed@neaps + (speed@springs - speed@neaps)X(range - range@neaps)/(range@springs - range@neaps)
Speed = 0.8 knots + (1.7 knots – 0.8 knots)X(3.1 m – 2.20 m)/(4.73 m – 2.20 m)
Speed = 0.8 knots + 0.9 knotsX 0.9 m/2.53 m
Speed = 0.8 knots + 0.32 knots = 1.1 knots