2 Weather
The weather, especially the wind, is critically important to sea kayakers. It’s essential to know how to find and interpret forecasts, and this chapter begins by looking at that. It’s interesting, and sometimes useful, to know a little bit about how the weather works, so the later sections of this chapter cover some basic meteorology.
2.1 Weather forecasts
2.1.1 Sources of forecasts
The main thing to know about the weather is where to find a good forecast and how to interpret it.
Unsurprisingly, the internet is a great source of weather information. Good sites include:
- https://www.metoffice.gov.uk - the ‘official’ forecasts for the UK, including marine forecasts
- http://magicseaweed.com - designed for surfers, but gives usable wind and wave information
- https://www.windy.com - my current favorite site
- https://www.windfinder.com - usable interface and a good phone app
- http://marine.meteoconsult.co.uk/marine-weather-forecast/weather-forecast-coastline.php
- https://www.windguru.cz
Most of these forecasts will give the following information:
- Wind speed - see notes on wind below.
- Wind direction - typically given as the direction that the wind will blow from. However, many forecasts will provide an arrow in the direction that the wind is blowing to. Useful to know, as we can plan paddles that start by going upwind to give us an easy homeward leg, or we can choose to find shelter behind the land (but beware the dangers of an offshore wind).
- Wave height - can our group cope with the forecast waves? What effect will they have when they strike the coast? Waves of 1 meter will feel serious to an inexperienced group. This is about the height when group members will sometimes disappear in the troughs.
- Wave period - long period swell is easier to paddle in than short period chop. However, long period swell implies a bigger wave for a given height, so the effect of the wave breaking will be more powerful.
- Wave direction - suggests where we can find shelter.
- Temperature - Clearly, the risks of hypothermia increase if it’s colder. However, the water temperature may be as big a factor as the air temperature. The water temperature varies little day to day, but does change through the year, being lowest around January to March and highest around August. Dressing for the conditions, and dressing for immersion, can mitigate this risk - but may not be an option for those who don’t yet own dry suits.
- Precipitation - (rain, snow etc.) - how miserable or pleasant will the day be? Heavy and persistent rain can make a group colder (and more miserable!) if not dressed for the conditions.
- Visibility - might it be misty or foggy, making it hard to navigate or see other craft on the water?
- Outlook - will it be sunny or cloudy?
Some weather forecast sources have more information than others and they present information in different ways. Try a few different ones to see what works for you.
It is useful to look at weather forecasts for the periods before and after our planned paddle:
Windy conditions before the time we’re on the water can generate waves that persist. And it’s possible that the timing of any weather changes isn’t forecast precisely.
It’s useful to be aware of any forecast changes later in the day - these might occur earlier than forecast, and, of course, it’s possible that the paddle takes longer than we expect.
2.1.2 Understanding forecasts
It’s important to understand what the forecasts mean. Often, the settings on a weather app or site can be changed to make this easier - for example, you might prefer the temperature in Centigrade or Fahrenheit, or you might want the wind speed in knots or on the Beaufort Scale.
Many forecasts use symbols to describe the weather. These will vary a little between forecasts (so check!), but they’re likely to be similar to those used by the UK Met Office, shown below
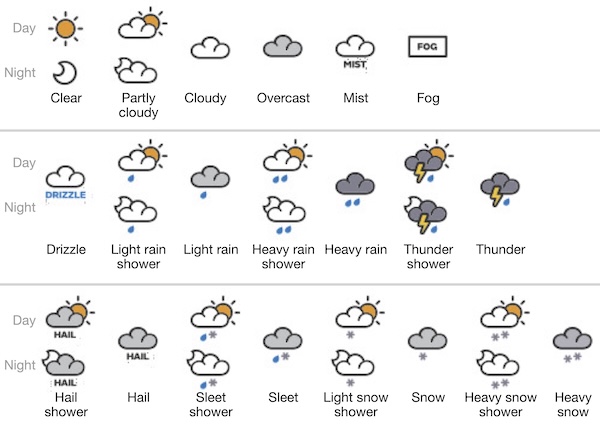
Some forecasts will give a probability for rain (e.g. 60%). On a Met Office forecast this gives the chance that at least 0.1mm/hour of rain will fall during the 1 or 3 hour period being forecast.
2.2 Wind
2.2.1 Wind strength
It is important to be able to understand the effect that the wind will have on us as sea kayakers.
The wind speed given in a forecast is the predicted wind speed at 10 meters above the ground in an an unobstructed location. At sea, this might be a close reflection of what we experience, but inland, or near land where the wind is blowing offshore, the actual wind speed near the ground may be affected by things like hills, valleys and trees. The speed given is an average over 5 or 10 minutes and the wind will constantly vary above and below this value. Typically, we can expect gust of a third greater than the forecast average wind, although many forecasts will predict the wind speed in gusts.
The table below describes conditions at each level of the Beaufort Scale, along with wind speed in knots:
| Beaufort force | Speed in knots | Sea conditions | Land conditions | Paddling |
|---|---|---|---|---|
| 1 | 1-3 | Small ripples | Smoke drifts, but wind vanes don’t move | Easy |
| 2 | 4-6 | Small wavelets that don’t break | Wind felt on face, leaves rustle and wind vanes move | Easy, small choppy waves start to form. |
| 3 | 7-10 | Large wavelets, which occasionally break | Leaves and twigs in motion, light flags extend | Fairly easy. Noticeable work paddling into headwind. Novices struggle in crosswind. |
| 4 | 11-16 | Small waves, frequent white horses | Raises dust, small branches move | Effort into headwind. Following seas start to form. Novices struggle to control the boat. Can be difficult to keep groups together unless all are competent. |
| 5 | 17-21 | Moderate longer waves. Many white horses, some spray | Small trees sway | Hard effort and paddle flutter. Cross winds awkward. Constant effort and concentration required to control the kayak. |
| 6 | 22-27 | Large waves, extensive foam crests and spray | Large branches in motion, hard to use umbrellas | Very hard effort. Limit of paddling any distance into wind. Following seas demand concentration. Only suitable for short trips by experienced paddlers. |
| 7 | 28-33 | Sea heaps up, foam starts to streak | Whole trees in motion, inconvenient to walk against wind | Strenuous and likely dangerous. Following seas need expertise. Paddling across wind very hard. |
Note that many weather apps allow the user the option of choosing the units that the wind speed is presented in. The Beaufort scale might be a good choice for those learning how to interpret forecasts - it proves a simple scale that relates directly to sea conditions. Many more experienced sea paddlers prefer to use knots to enable greater precision in their understanding of the wind… but most will still be relating this to the Beaufort scale in their minds.
2.2.2 Effects of land on wind
Most people will be aware that land features can affect the local wind around them - on a windy day, you can often find shelter behind a crag facing away from the wind. In fact, the land has a marked effect on the wind, often affecting wind patterns 10 miles or more out to sea. The effects of land features on the wind are going to be important for sea kayakers who mostly spend their time near the coast.
2.2.2.1 Sheltering from the wind
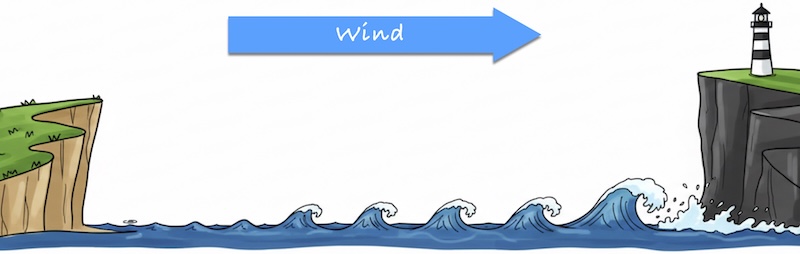
There will often be some shelter from the wind on coastlines where the wind blows offshore.
A force 5 wind (20 knots) is blowing from the west-north-west across Trearddur Bay on Anglesey:
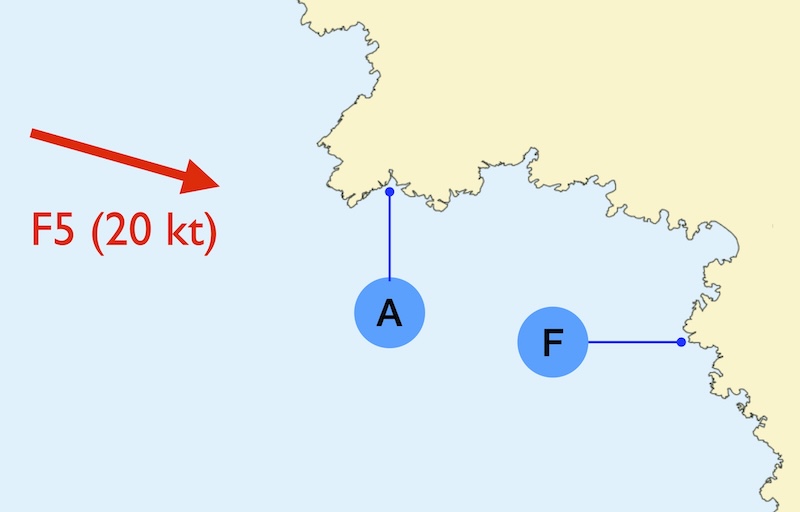
What conditions might be expected:
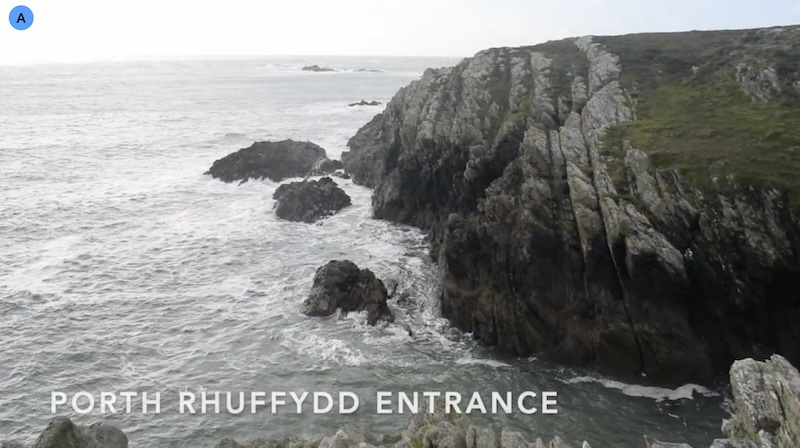
At point A: near Porth Ruffydd
At point B: to the south of Raven’s Point
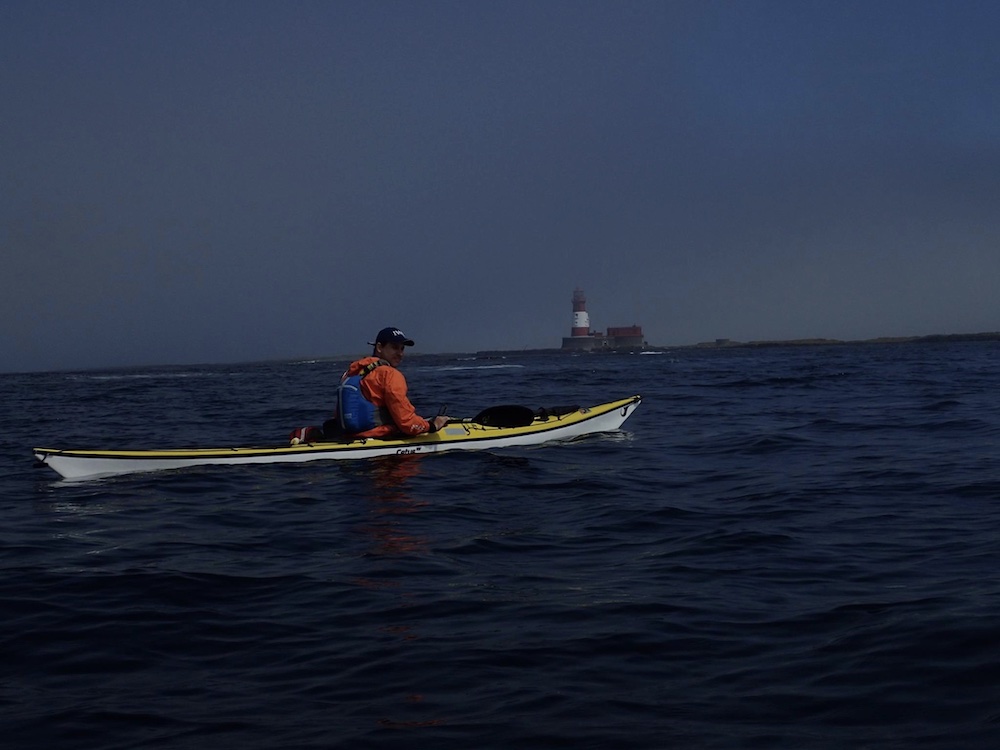
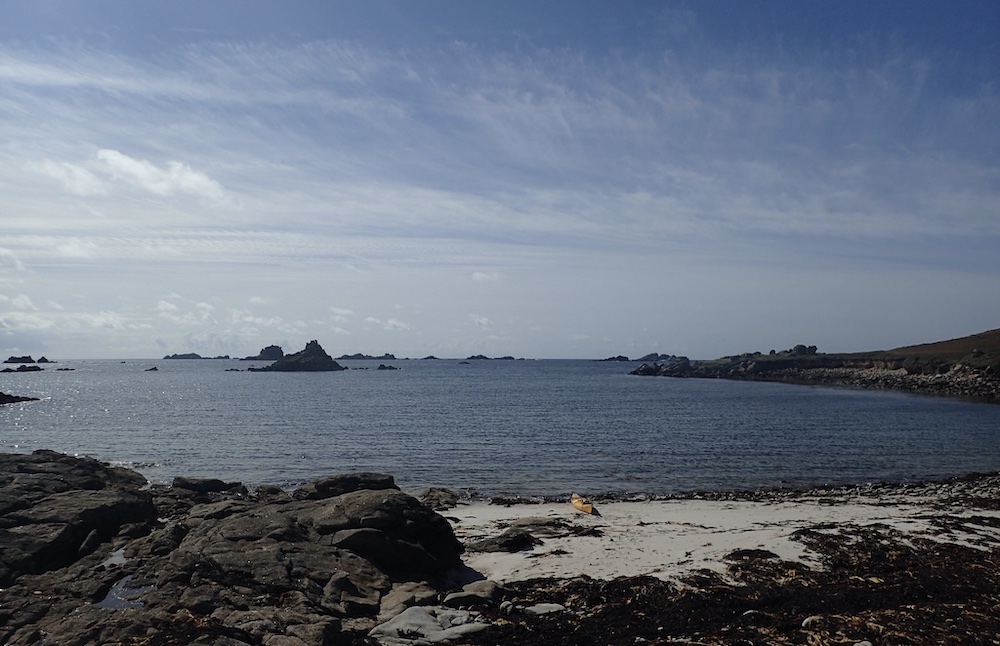
At point A, there is shelter from the land immediately to the west. We expect little wind under the cliffs and a benign sea state. Here’s a photo taken at point A in these conditions:
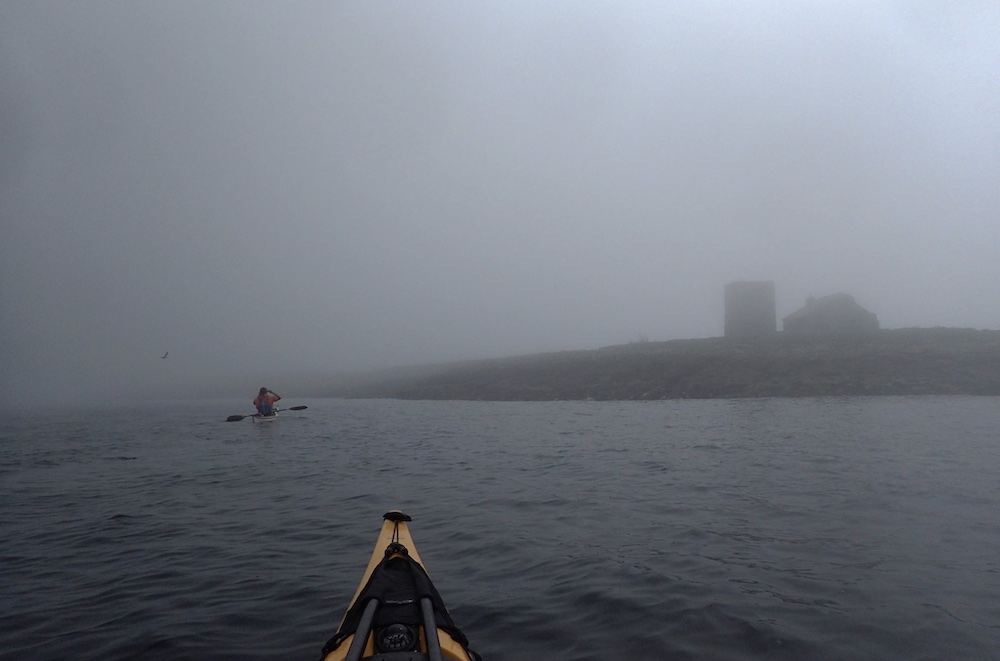
At point F, there is no shelter at all. To the west of Anglesey, there is no land until the coast of Ireland, almost 100 km upwind. We expect to feel the full force of the force 5 wind, and rough seas. Here’s a photo taken at point F looking south in these conditions:
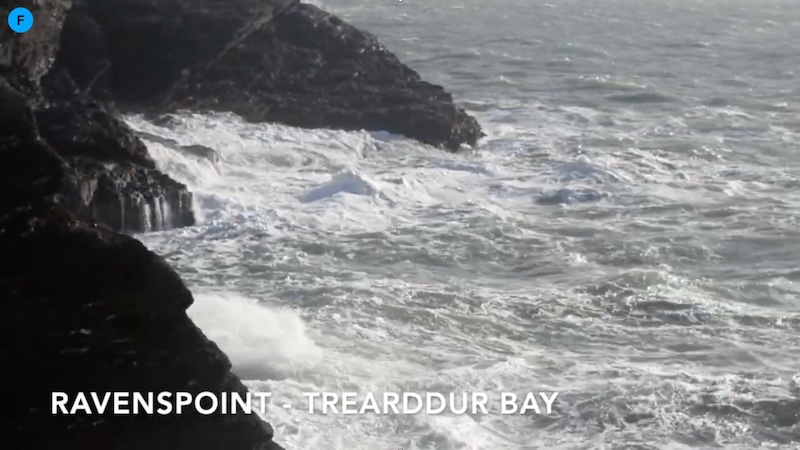
These images come from an excellent video by Nick Cunliffe of Flow State Adventures. The video is well worth taking 15 minutes to watch - it goes into far more detail on the effects of the diminishing shelter around the bay from point A to point F.
In order to provide shelter from wind, the coastline needs to have some height - e.g. from cliffs, steep hills or a tall forest. If the land slopes gradually to the sea, there may be much less shelter:
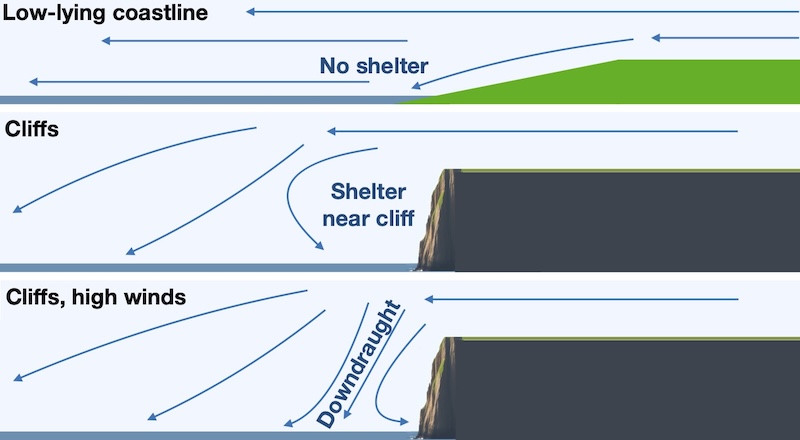
Downwind of a tall obstruction, eddies may form, and the local wind may even be blowing lightly back towards the obstruction.
In high winds, there will still often be shelter below cliffs. However, sudden downdrafts can blow down from the cliff onto the water. These winds can scatter a group and blow strongly enough to capsize inexperienced paddlers.
Notes that the shelter provided by a steep coastline is limited to the area immediately below the steep coast. Paddlers who stray away from the coast will find the wind strength increasing, posing a danger of being blown out to sea.
Of course, any land, even a low-lying spit, will provide shelter from waves.
2.2.2.2 Friction
The wind is slowed down close to the earth’s surface by friction. The sea is relatively smooth, and winds at sea are often 80-90% of the high-level wind. The land typically has more features and is rougher - it often slows the wind to 50% of the high-level windspeed. As a result, we should be wary of estimating winds out at sea from those which we experience on the journey to our launch point.
Because of the Coriolis effect, the high level wind tends to follow the isobars - lines of equal pressure. When the wind is slowed at lower levels, the Coriolis effect is less, so the wind tends to angle to flow inward towards areas of lower pressure.
As a result, the wind will tend to turn to the left as it flows onshore (in the northern hemisphere). If wind blows offshore, it will tend to accelerate and turn to the right.
When the wind blows nearly parallel to the coastline, this can have interesting effects.
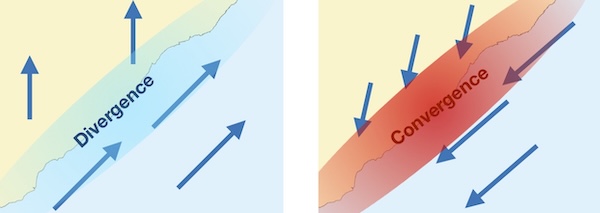
If the wind is blowing along a coastline, or slightly onshore, with the land on its left, the wind will tend to turn to the left as it blows onto the shore. The result is a zone of diverging wind over the coast, resulting in lighter winds. If the wind is blowing along the coast, or slightly offshore, with the land on its right, the wind will turn right as it blows offshore. The wind will hence converge and increase in strength near the coastline.
2.2.2.3 Funneling
When there is a gap formed by areas of high ground, the wind may funnel through it.
This effect can happen at any breaks in a steep coastline. On a windy day with an offshore wind, you’ll often find strong winds blowing out of bays that break up an otherwise steep coastline.
Similar effects can occur at headlands, especially when they have high land on them
As we shall see, tidal streams behave similarly, and waves also tend to concentrate energy at headlands. As a result, the conditions at headlands can be much more challenging than those in adjacent bays.
2.2.3 Sea and land breezes
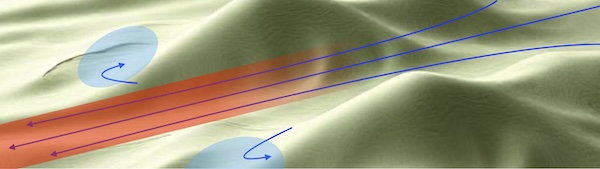
Sea breezes can develop on sunny days with light winds, especially in Spring and earlier Summer. Being a large body of water, the sea’s temperature doesn’t change much during the day. However, the land will heat up substantially and warm the air above it. This causes air over the the land to rise, often forming cumulus clouds.
Air from the sea moves towards the land due to the reduced pressure created by the rising air. Ultimately, this sets up a circulation with air moving from sea to land, being warmed, rising, cooling and spreading back over the sea.
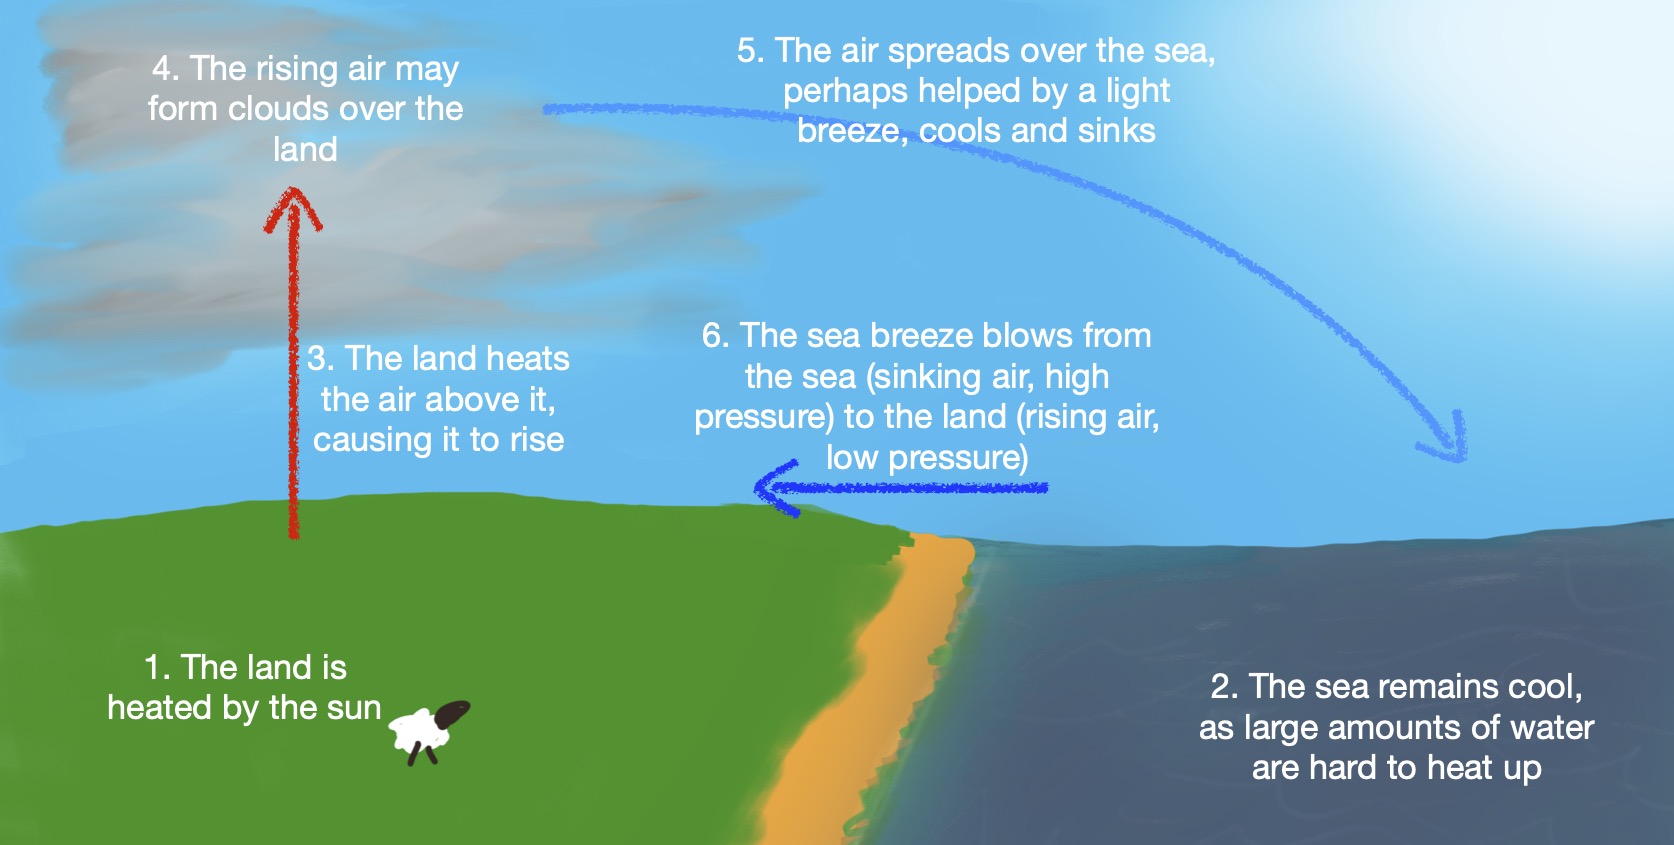
The sea breeze can create a strong onshore wind in the afternoon on warm days.
A related set of effects lead to winds being in general stronger during the day and especially the afternoon than they are during the night and morning, even when sea breezes don’t occur.
At night, the opposite effect can occur. The land loses heat quickly, whilst the sea tends to remain at a constant temperature. As a result, a ‘land breeze’, blowing from the land out to sea, can occur.
2.2.4 Anabatic and katabatic winds
In hilly areas, heating of mountain slopes can lead to localised rising air, in a manner similar to a sea breeze. This effect, known as an ‘anabatic wind’, can replicate or increase the sea breeze effect.
In evenings or overnight, mountain slopes can cool faster than the surrounding low lying land and any nearby sea. The air above these slopes cools and becomes denser. Gravity pulls this cool air down the slope, creating a katabatic wind. In some areas of the world, especially around ice sheets, these winds can be sudden and violent.
2.2.5 Wind, waves and tide
When wind blows over the water, it creates waves. The harder and longer the wind blows, the higher the waves. Swells are caused by winds and storms far away - and they often arrive on our shores on days that aren’t windy.
When waves move against a stream of moving water, the waves become steeper and break. The opposite happens when waves travel in the same direction as the stream - the waves flatten out. This effect can happen:
Due to tidal streams at sea - against either wind created waves (known as ‘wind against tide’) or swells
Due to flows in rivers and estuaries - where the flow out of the river meets swell or wind waves from the open sea
These effects can have a significant effect on conditions.
There’s much more on wind, waves, tide and how they interact in the surf and swell section.

2.2.6 Accounting for wind
We need to think about the wind in relation to the coastline that we’re paddling. Wind speed and direction are a critical element in deciding whether and where to go paddling. It might be:
Onshore - we’ll be exposed to the wind and waves, and it may push it towards a hazardous shoreline.
Offshore - we may be able to find shelter from the land, but need to be aware of the hazards of being pushed offshore. If the coastline is steep enough, there will likely be shelter near it, but this shelter will rapidly diminish and the wind strength will increase away from the shoreline. This can be a serious danger, especially for weaker paddlers or SUPs - Data obtained from the RNLI covering a period from 2020 - 2022 show that 54% of SUP rescues requiring RNLI assistance, cited offshore winds as a contributing factor. This is an increase from 33% in 2019. If the shoreline is flat, there may be limited shelter. Having said all that, sea kayakers will often choose coastlines with offshore winds to seek shelter on windier days.
Along the coastline from in front of us - which is going to make progress hard work.
Along the coastline from behind us - which may help our progress, as long as we have the skills to paddle downwind in the forecast wind and wave conditions… and, of course, if we have considered if we need to get back upwind later in the day.
Too strong for the competence of the group to handle… especially given how fatiguing paddling in wind can be. As a guide, anything more than force 3 can feel very challenging to inexperienced paddlers.
If the wind is strong (say force 4 or more), it often makes sense to seek coastlines that are sheltered from the wind. Be aware that the wind on these coastlines will blow offshore, creating a potential hazard. What seems like a light wind close to land and cliffs may be a strong wind further out. If the group gets blown away from land, getting back to shore may be difficult.
The amount of shelter that the land provides depends on the topography. Flat land without vegetation will provide little shelter. Tall cliffs are likely to provide excellent shelter from the wind - but beware downdrafts in very windy conditions. Any steep coastline, even if cliffs are only a few meters high, can provide useful shelter if a group stays close in under the cliffs. Some coastlines that provide good shelter can have areas where the wind blows strongly off the land. This can occur at gaps in cliff lines and where valleys that run parallel to the wind run down to the sea.
It also makes sense, if planning a round trip, to start by paddling upwind, so that the group gets blown home. This provides a significant safety margin compared to a day that starts downwind.
It’s also worth checking how the wind is blowing in relation to any tidal streams - if the wind is blowing opposite to the tidal stream, rough conditions will often result. There’s more on this effect in the notes on tide and waves.
The map below show the island of Anglesey with elevation shown (green areas are ~150m) and cliffs shown as red stretches of coastline.
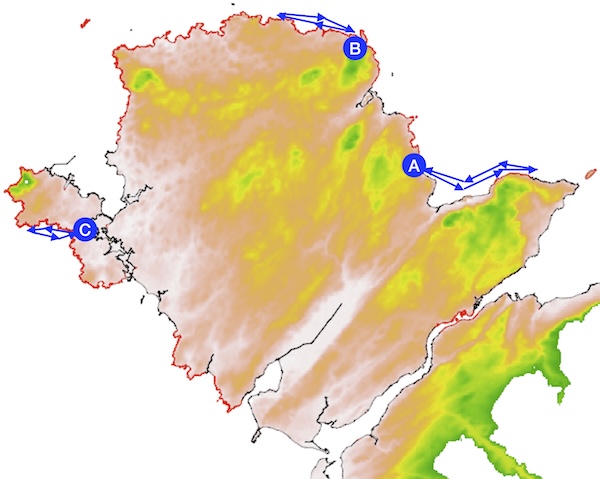
You are contemplating the paddles shown, all coastal round trips departing and returning to points A, B or C. What is the best option given the following wind forecasts:
Force 1-2 westerly?
Force 3 easterly?
Force 5 south-westerly?
Force 8 south-westerly?
A force 1-2 wind will have less influence on our choice of paddle, so A,B or C will be possible. It may still be good practice to paddle upwind first in case the wind increases (as paddles B and C do), but we might expect paddle A to be well sheltered from this light wind on the east side of the island.
With a force 3 wind, it is sensible to paddle upwind first, then be pushed back to the start by the wind later in the day. Only paddle A starts upwind with an easterly, so this seems the best option.
We’ll likely want to shelter from a force 5 wind. Being on a coast open to the south-west, paddle C will be exposed to the wind. The low-lying valley across the island means that there will likely be little shelter for paddle A. Paddle B makes the most sense. It is sheltered by some higher ground and some sea cliffs. It begins by paddling against any westerly component of the wind blowing along the coast.
In a force 8 wind, shelter is likely to be imperfect on any of Anglesey’s coastlines, given it’s a reasonably low-lying island. The best option is likely to be taking a day off paddling.
2.3 Other considerations
2.3.1 Visibility
Visibility is simply a measure of how far you can see. On a clear day, you might be able to see about 3 miles, or much further if you climb a hill. In thick fog, visibility might drop below 20 meters.
Visibility information is available in weather forecasts, and many will use special symbols for mist or fog. The table below gives the descriptions used by the UK Met Office:
| Description | Distance at which objects can be clearly seen in kilometres |
|---|---|
| VP (Very poor) | <1 |
| P (Poor) | 1-4 |
| M (Moderate) | 4-10 |
| G (Good) | 10-20 |
| VG (Very good) | 20-40 |
| E (Excellent) | >40 |
2.3.2 Fog
Two types of fog can form over the sea:
- Advection fog is caused by moist air moving over cold water. It is most common in Spring and early Summer. It forms in light winds - anything more than 15 knots tends to lift the fog from the surface. It can come in suddenly and persist for long periods.
- Radiation fog is caused by the land cooling during the night. Although it is formed over land, it can drift over the sea. This fog is more common in Autumn and Winter, although it can form on colder mornings at other times of year. Once over the sea, it tends to disperse.
Fog prevents an obvious challenge if the group’s navigation skills are imperfect - it’s too easy to become disorientated. There’s also a danger of collisions with other craft, especially if you’re paddling in busy areas like harbors or shipping lanes. Be aware that fog is a persistent and somewhat unpredictable occurrence in some parts of the world at certain times of year. For example, between between April and September, warm air passing over the cold North Sea often produces a thick sea fog called the ‘Haar’, which can roll in rapidly to the UK’s north eastern coastlines with a slight sea breeze.
2.3.3 Thunderstorms
Thunderstorms present dangers to a paddling group that can’t be mitigated by tactics or better skills. Apart from the serious risk of a lightning strike, thunderstorms bring strong wind squalls and reduced visibility. If thunderstorms are forecast (they’re typically shown by a cloud symbol with a lightning bolt), stay off the water. If you get caught out by an approaching storm, find somewhere to land and seek shelter (although not under isolated trees). If there’s no shelter, crouching down away from the water and your boats and equipment is the safest option.
2.3.4 River levels
River levels vary according to how much rain has fallen over the last few hours. The level of rivers is affected by how heavy the rain has been (e.g. light showers vs. heavy continuous rain - remember the weather forecast symbols) and how long it has been raining for. The dangers posed by paddling on rivers can vary markedly with the river level - slow-moving lazy streams at normal levels can become dangerous fast-flowing torrents when high.
In recent years, accurate information on river levels as become available online. Useful sources include:
https://riverlevels.uk : a site that presents gauge data in context of typical levels.
https://riverpredictor.uk : gives current levels for many UK whitewater runs together with forecasts for the coming hours and days
Apps like ‘RiverApp’ and ‘Rainchasers’
Whitewater kayaking guidebooks
A number of factors affect river levels in somewhat complicated ways. Whilst this is likely to be of less interest to the sea paddler, it is clearly of great relevance to whitewater boaters… although perhaps less now that reliable data and forecasts can be downloaded to your phone. Here’s a brief rundown of some of the main factors:
Rainfall: clearly more rain will bring the rivers up higher and faster. Note that there is likely to be more rain at higher altitude in the headwaters of the river than at lower levels - average annual rainfall increases by 8% for every 30 m height gain over sea level totals.
Time: It takes time for the rain, which is likely falling most on higher ground, to make it into the river. As a result, there will be a lag between the rain starting and the river rising. When the rain stops, the river may continue to rise, and the flow will likely reduce slowly.
Temperature: If it is cold, the rain at high levels may fall as snow, which won’t contribute (immediately at least) to river rises. If there is a frost, river levels are likely to be low in the morning as water is frozen in place.
Infiltration: Some of the water from rain will infiltrate into soils and rock rather than run into rivers. Intense rain may overwhelm the ability of the soil to absorb more water. And ground that is saturated by previous rain wont be able to infiltrate any more - a phenomenon often linked to winter floods.
Snow melt: In some regions of the world, rivers are mostly fed by melting snow and glacial ice in the main paddling season. In these areas, the daily temperature and the amount of winter snow will drive river levels. Rain falling on snow can cause a large amount of melt water to run down quickly, causing rivers to rise rapidly.
Nature of the drainage area: If the drainage area is covered in trees, they will intercept and slow the rain, resulting in slower river rises. If the drainage area is rocky, there may be little infiltration and run off may be rapid.
Area of the drainage: Rivers with a large drainage area tend to rise and fall more slowly compared to those will smaller catchments.
Drainage basin shape: round or compact catchments areas will lead to more rapid runoff than elongated basins.
2.4 Some meteorology
It’s not essential by any means to understand the science of what drives the weather to have a safe and enjoyable time on the sea. However, it does help to bring some of the other information here together. And being able to relate what you’re seeing in the sky to the forecast and the science of the atmosphere can be fascinating.
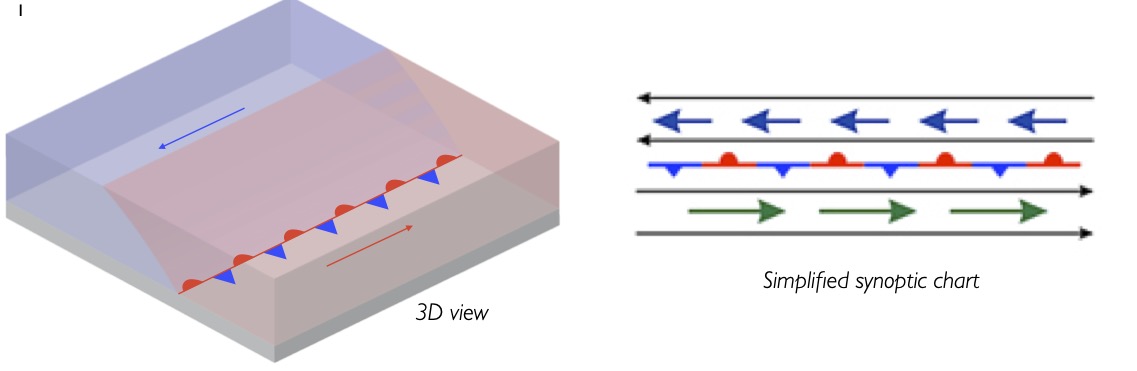
2.4.1 Introducing synoptic charts
Synoptic weather charts show the pressure at the earth’s surface. They are rather like contour maps, but instead of contours of constant height they have isobars showing lines of consistent pressure. Areas of low and high pressure appear as concentric rings. The chart also shows fronts - boundaries between warm and cold air masses.
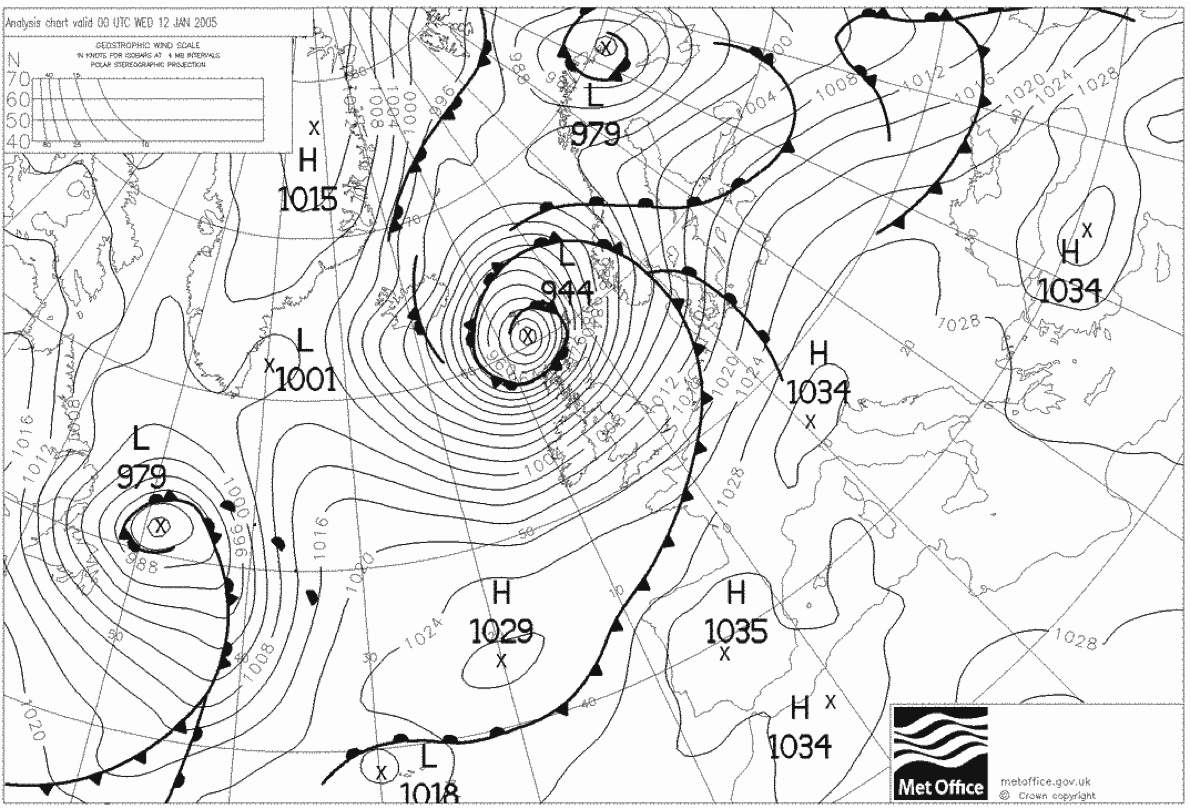
This chart shows an especially nasty area of low pressure (marked L 944) centred north of Scotland, bringing strong wind and rain. We can see a cold front (black line with triangles) marking the boundary between warm air in front and cold air behind, as well as a warm front (black line with semicircles) which has warm air behind and cold air ahead. The area between the two is called the warm sector. It is the wedge of warm air that has pushed into the cold air to the north. The line with both triangles and semicircles is called an occluded front. It shows where the warm air has been lifted completely away from the ground.
Where the isobars are close together, we expect strong winds. Here, storm force winds were blowing over much of the UK, whilst Italy would have experienced light winds. The wind will blow anticlockwise around low pressure areas, clockwise around high pressure. The wind closely follows the isobars, although the direction will be angled 15-30˚ inward towards low pressure near the earth’s surfce - so we would expect wind to be blowing from WSW over Wales given the chart above.
Across Spain, the Mediterranean and Italy, there is high pressure. The weather is likely sunny and clear. Notice that the isobars are widely spaced in this area, indicating light winds.
We said that the wind is stronger where the isobars are closer together. It’s possible to estimate the wind speed using the ‘geostrophic wind scale’ shown at the top left of the image.
For example, say we’d like to estimate the wind in Cornwall from the chart shown above. We measure the shortest distance between the isobars over Cornwall:
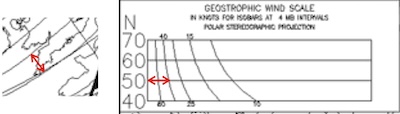
We then transfer this measurement (using a pair of dividers, or a ruler) to the geostrophic scale. We measure from the left hand axis of the scale. Because Cornwall is at 50˚N latitude (as we can see from the grid on the chart), we measure along the ‘50N’ line. The estimated geostrophic wind can be found from reading off the value of the curve we measure to - in this case 40 knots. The geostrophic wind follows the isobars, so we’d expect this wind to be a westerly.
The geostophic wind is the wind we’d expect at high altitude if the isobars were straight. We need to adjust it to find the wind expected on the surface. There are more complicated ways to do this, but as a rule of thumb:
Over the sea, the surface wind will be 2/3 of the geostrophic wind and backed (i.e. direction changed anticlockwise) by about 15˚
Over the land, the surface wind will be 1/2 of the geostrophic wind and back 30˚
So, over the sea near Cornwall, we might expect 27 knot winds from around 255˚. Over the land, we’d expect this to drop to 20 knots, and the direction to be 240˚.
As a very rough guide, assuming westerly winds, the surface wind speed in knots is around 4 times the number of isobars running across the UK mainland.
In order to learn a little more about how to interpret these charts and understand how the weather works, we’ll need to delve into some meteorology - the science underlying how the weather works
We’ll obviously only scratch the surface of the complex science of meteorology here. If you’re interested in learning more, the RYA Weather Handbook by Chris Tibbs makes a good read. For those who want to understand the science in greater depth (but avoid the heavy maths that tends to accompany it), I recommend “Meteorology Today: An Introduction to Weather, Climate and the Environment” by C. Donald Ahrens and Robert Henson.
2.4.2 High and low pressure
The synoptic chart showed some areas of low pressure and some areas of high pressure. What’s going on these areas and what weather might we expect?
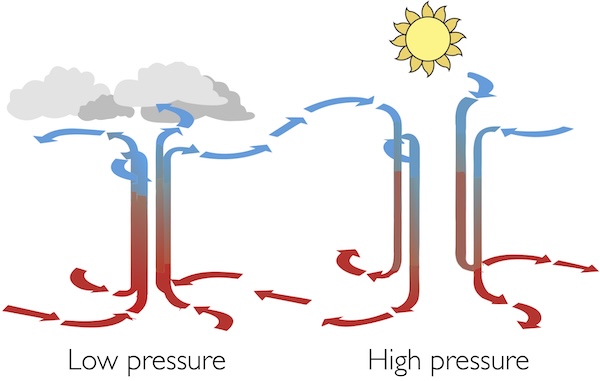
In some areas, air is rising upwards from the earth’s surface, leaving low pressure behind. As warm moist air rises, it cools. The moisture condenses, forming clouds and perhaps bringing rain. So areas of low pressure, or depressions (L on the chart), tend to cause unsettled weather, often bringing stronger winds and rain. Low pressure can form due to localized heating of the earth, but in the UK we more often associate it with large weather systems called ‘depressions’ that sweep in from the Atlantic. We’ll look at these in more detail shortly. Remember that in the northern hemisphere, air circulates anticlockwise around a center of low pressure.
In other areas, air is sinking towards the earth. There’s no mechanism for clouds to form when air is sinking, so high pressure systems, or anticyclones (H on the chart), tend to be associated with fine summer weather. In winter, the clear skies of a high pressure system are associated with cold days and even colder nights - with no clouds to trap heat near the earth. Air circulates clockwise around an anticyclone - the opposite to a depression.
Semi - permanent areas of high pressure often develop over the Azores and Southern Europe. As these come north in the summer, they can serve to push depressions northwards, keeping them away from the UK. These anticyclones develop in the warm mid-latitude cell (see below) and are warm-cored features.
We also see areas of higher pressure between depressions, giving a temporary respite from poor weather. These develop in the cold polar air, are cold-cored and tend to move across the globe. They do sometimes warm through and stay put.
2.4.3 The global circulation
The sun heats the earth most at the equator and least over the poles. At the equator, the heated air rises and at the poles it sinks. Rather than a single convection cell stretching from equator to pole, the atmosphere actually has 3 convection cells in each hemisphere.
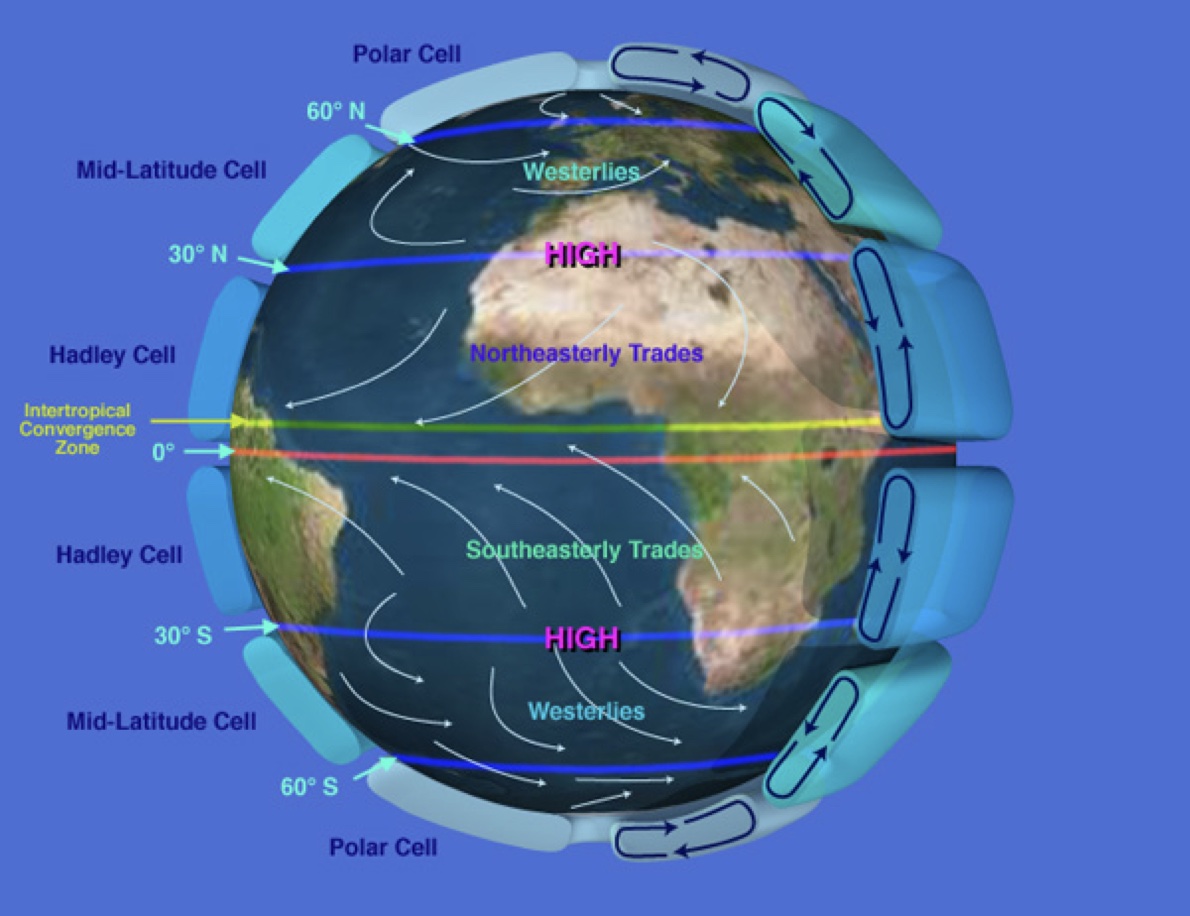
Notice that in some areas, like the equator, and northern Europe, this circulation will tend to make air rise, leading to low pressure and rain. At the equator, this manifests as afternoon storms. Increased coriolis forces due to the spinning earth further north means to low pressure across northern Europe tends to be associate with large rotating storms.
In other areas, like northern Africa and the poles, the air tends to descend. This tends to cause high pressure and clear skies in these areas. This is responsible for the deserts of north Africa, and the light winds of the ‘Horse Latitudes’ around 30˚N.
The UK is situated close to the boundary between the Polar Cell and the Mid-Latitude cell. The cold air to the north and the warmer air to the south tend not to mix. They interface at a boundary known as the polar front. This boundary moves around, tending to be further south in the winter and further north in the summer. As a result, the weather in the UK will likely be greatly affected by the direction in which the winds are blowing.
2.4.4 Air masses affecting the UK
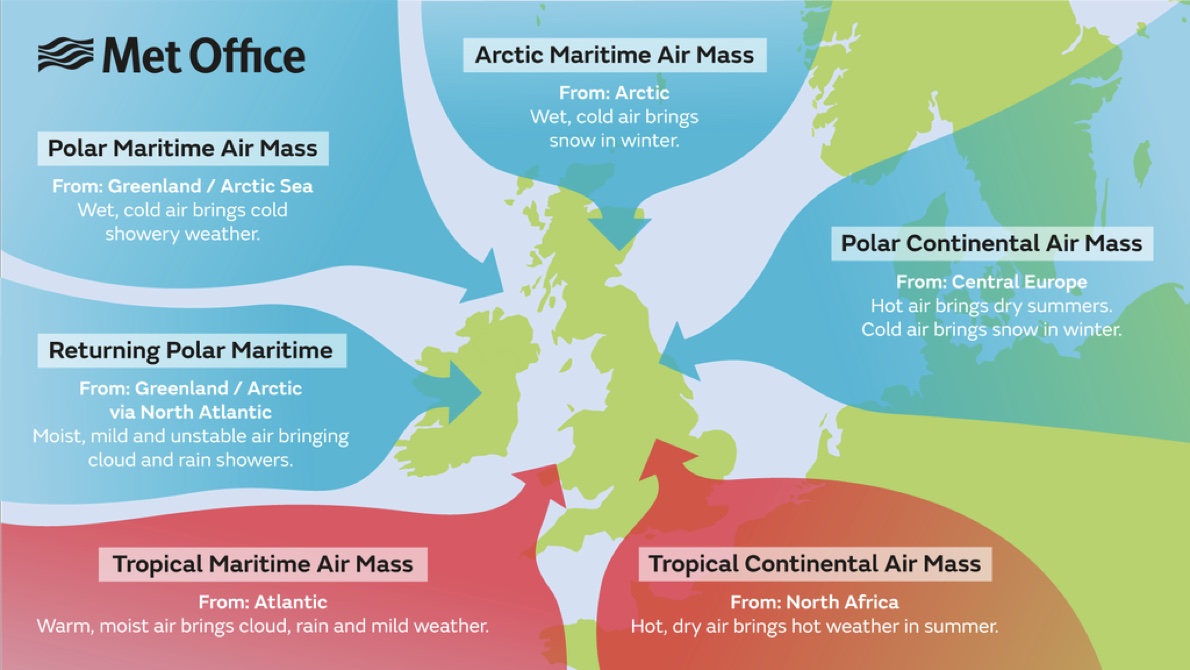
As we’ve seen, the UK sits close to the Polar Front, with cold air to the north and warmer air to the south. We also know that to the west of the UK, there’s a large area of ocean, whereas to the east, there’s a large continent and little sea. It seems likely that the polar front and the divide between ocean and land will affect the air that lies in different directions from the UK.
Air that spends time over cold land cools and becomes fairly dry. Over a warm sea, the air will be heated and become moist. Depending on the wind direction, air that has spent time over other parts of the world can blow over the UK. The diagram below shows these air masses and the wind directions that bring them to us:
Air masses move, but when they meet they tend not to mix well. Instead, there are sharp divisions between them known as fronts.
Warm air tends to rise. As air rises, it cools and any water vapour that it is carrying will form clouds and potentially rain. The condensation of water vapour makes more heat available, such that wet air tends to rise further and faster than dry air.
What might cause air to rise? The air masses shown above are fairly homogeneous, so there will be little tendency for air to move vertically. There are two key processes that cause air to rise, forming clouds and potentially rain:
Being pushed up by another air mass at a front - more of this later.
Being heated by the warm earth below, which in turn is being warmed by the sun. This is the process by which white puffy cumulus clouds develop on sunny days and how they can eventually develop into violent thunderstorms in the afternoon.
2.4.5 Depressions
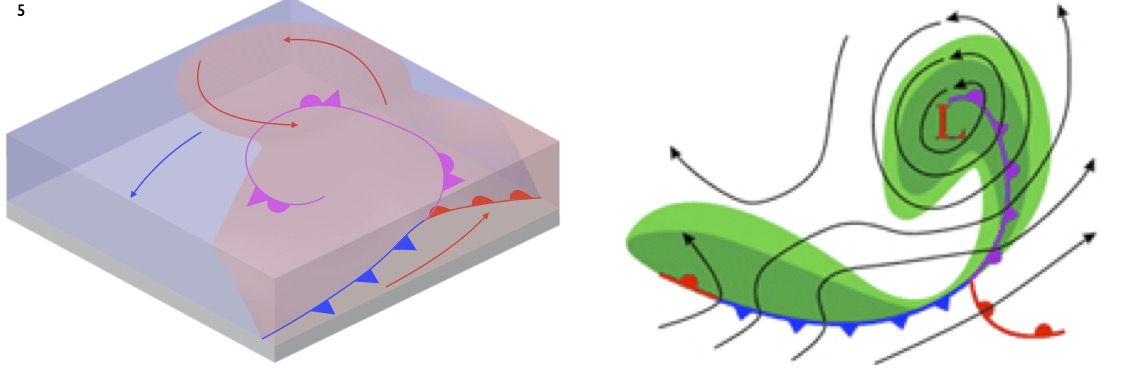
Understanding depressions requires an appreciation for the 3-dimensional structure of the atmosphere. However, on synoptic weather charts, we only see the isobars (lines of equal pressure) and fronts as they are at the surface of the earth. In this description, 3D illustrations are shown next to a schematic of a synoptic chart.
Let’s look more closely at the polar front, and particularly the boundary between polar maritime air to the north and tropical maritime air to the south. Both air masses will be moist, but they have different temperatures. Because the warm air mass is less dense than the colder one, the front is not vertical - the warm air mass tends to lie over the colder.
Disturbances along the polar front cause the warm air from the mid-latitude cell to intrude into the colder air mass to the north. This sets up the conditions for the formation of an area of low pressure, or a depression. We’ll look at these in some detail, as they are responsible for much of the UK’s bad weather.
The polar front is not a very stable situation - the warm air can tend to float over the cooler, and the jet stream wind blowing above can draw air in and up. Disturbances along the polar front cause the warm air from the mid-latitude cell to intrude into the colder air mass to the north.The rising air causes a reduction in surface pressure, causing wind. The low pressure draws in more warm air from the south, causing the area of low pressure to deepen. Because the earth is rotating, air does not blow directly in towards low pressure areas, but instead spirals in anticlockwise, rather like water down a plughole.
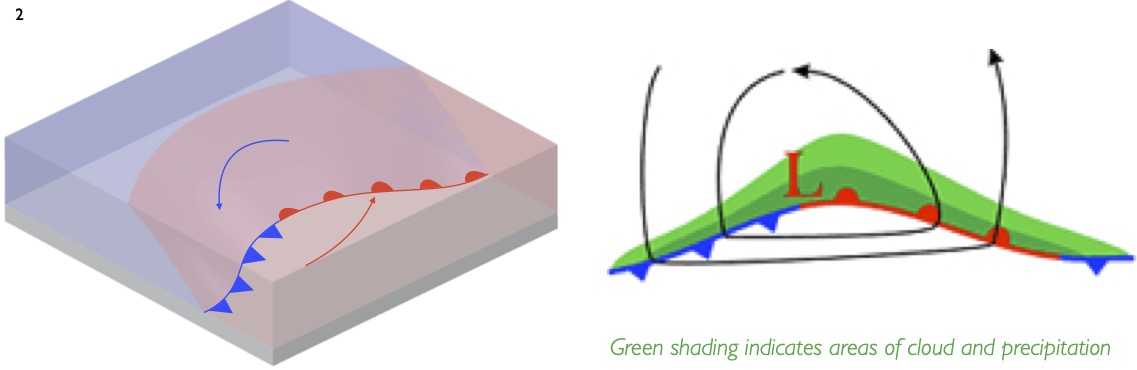
These processes become self-sustaining.The warm air rises, creating low pressure, drawing in yet more warm and wet air from the south. Pressure drops and a circulation of wind starts to develop around the disturbance in the polar front. At this stage the depression is known as an early-stage or wave-type low.
As the low develops, a wedge shaped area of warm air, known as the warm sector, develops. The depression is now fully developed, and significant winds are now blowing anticlockwise around the low pressure area.The boundaries between the warm sector and the colder air are known as ‘fronts’ and are named after the air behind them.The ‘warm front’ at the front of the warm sector has warm air behind, whilst the ‘cold front’ at the back has cold air behind it. Warm fronts are depicted with semicircles and sometimes shown in red. Cold fronts are marked by triangles and shown in blue
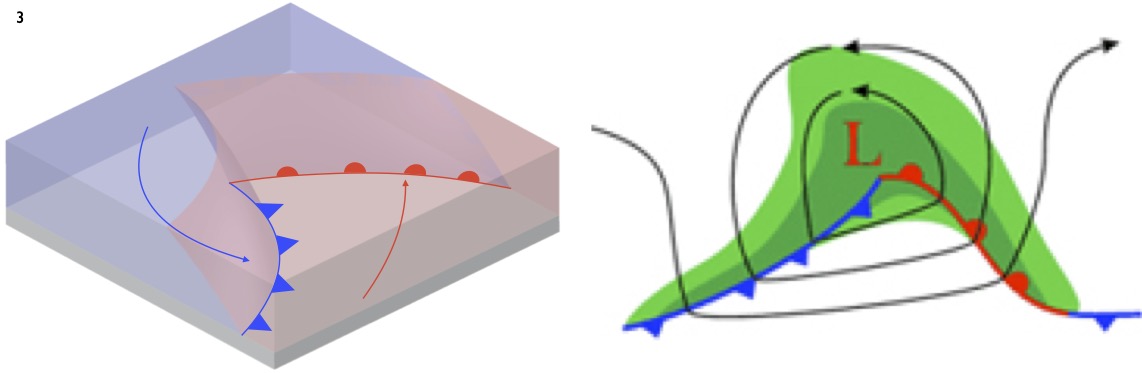
Further movement of the warm sector over the cold air mass causes some of the warm air to be lifted entirely off the ground.This is know as ‘occlusion’. On synoptic charts, an occluded front is drawn under this elevated warm air. It is marked with both semicircles and triangles and sometimes shown in purple. Once occlusion occurs, the depression will typically not reduce in pressure much further.
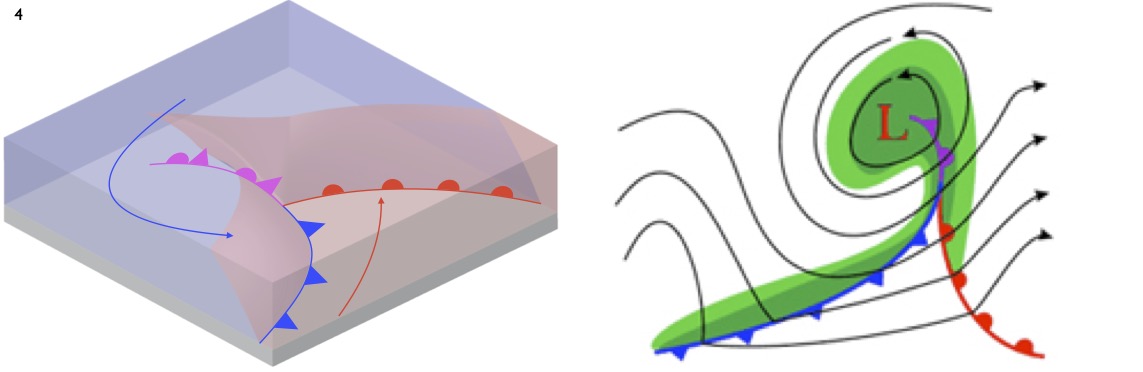
As occlusion continues,the system is cut off from the supply of further warm air and moisture from the south. As such, the depression cannot develop further and now starts to dissipate.
Synoptic diagrams from the COMET® Website at http://meted.ucar.edu/ of the University Corporation for Atmospheric Research (UCAR), sponsored in part through cooperative agreement(s) with the National Oceanic and Atmospheric Administration (NOAA), U.S. Department of Commerce (DOC). ©1997-2016 University Corporation for Atmospheric Research. All Rights Reserved.
2.4.6 Depressions in practice
The centers of most depressions pass to the north of the UK. As a depression goes overhead, we hence generally pass under the warm front, the warm sector and the cold front. Let’s take a closer look at a depression from the side, by taking a cross-section of it through the warm sector:
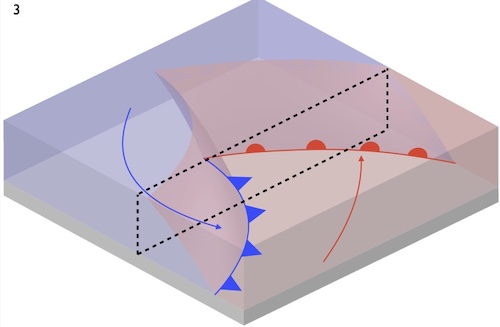
Remember that warm air is rising up along both of the fronts. Warm air rising leads to clouds and potentially rain. This should lead to a somewhat predictable sequence of weather, as shown in the diagram below.
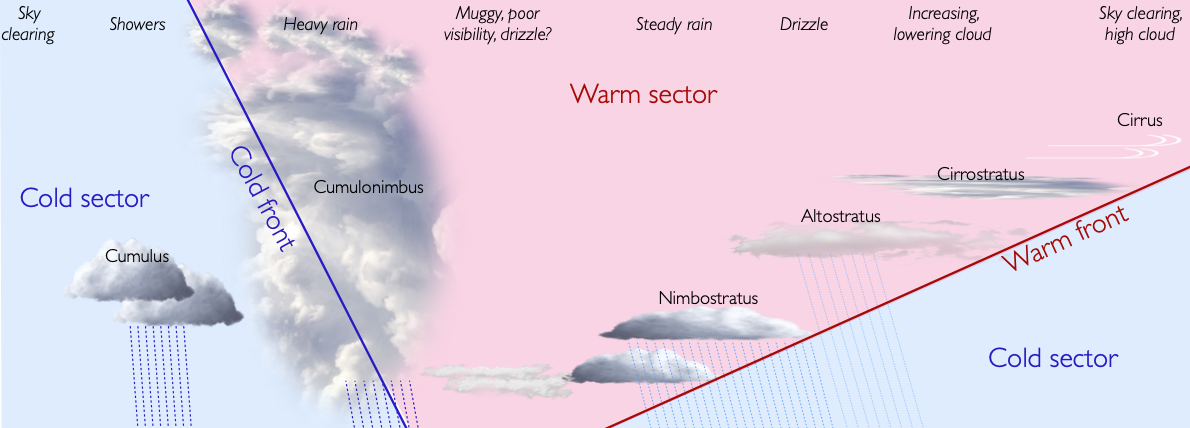
For more information on the cloud types described here, see the notes on clouds in the ‘Environmental clues’ section.
The first sign of the approaching depression is moist air rising high at the front edge of the warm front, causing ice crystals to be blown eastwards by the jet stream. These can be seen as high wispy cirrus, or ‘mares tails’. As the warm front becomes lower overhead, the high cloud develops into a thin layer known as cirrostratus. This cloud produces a halo around the sun or moon.
As the front comes lower still, layers of cloud form at mid levels, known as altostratus.
These clouds thicken and lower as the warm front draws near, eventually producing persistent rain near the warm front from featureless grey nimbostratus clouds.
Within the warm sector, humid damp air will bring poor visibility and intermittent rain or drizzle. Fog and mist is possible. However, as the depression tracks east, this weather may improve to give clear spells.
The arrival of the cold front is heralded by thicker clouds and heavier rain. The wind will tend to be gusty and there may be thunderclouds.
Behind the front, the sky should clear rapidly. It may be followed by cumulonimbus clouds that bring sharp showers. In practice, depressions rarely have the perfect form and weather sequence described. However, the sequence of events described above is a useful guide.
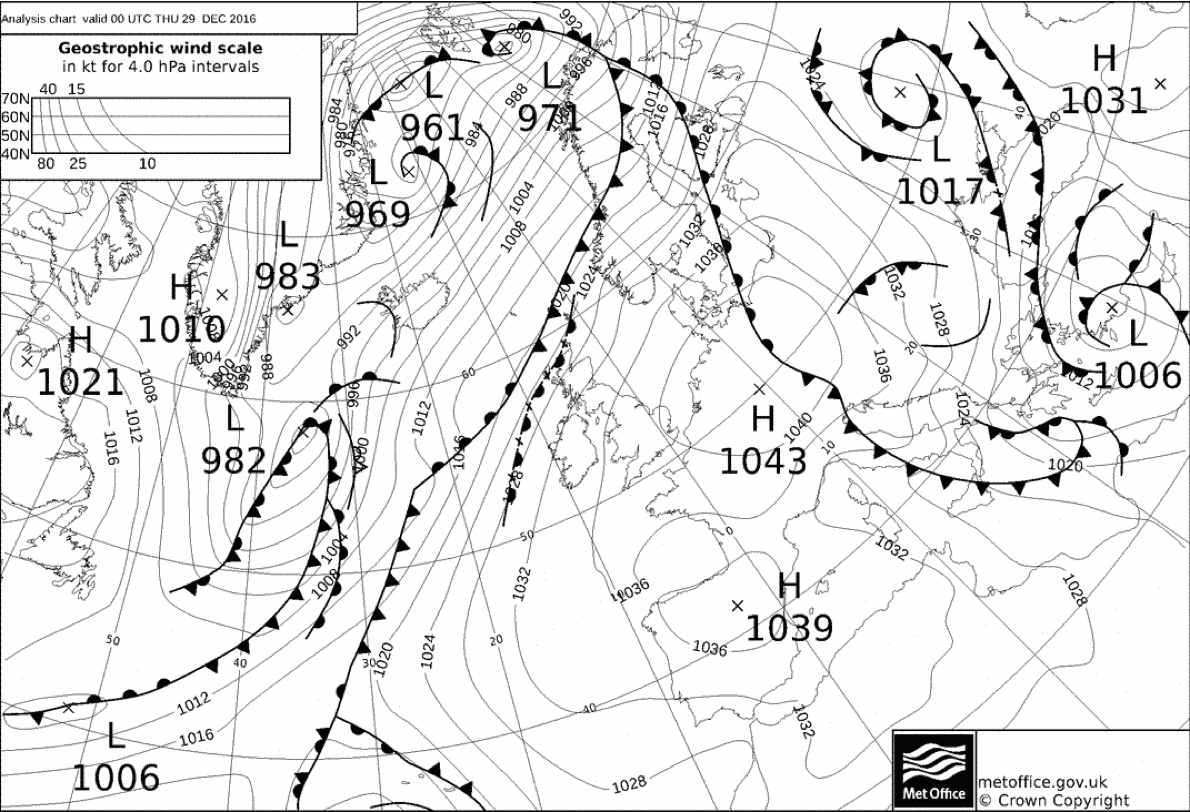
Looking at the synoptic chart below, what weather would you expect in Cornwall over the coming days?
Cornwall will shortly be affected by Low 991, with a series of occluded fronts likely bringing cloudy wet weather, with at least 2 distinct bands of rain as the low moves eastwards. The wind is from the south-west, but it will veer to the north-west as these fronts pass.
After the low pressure passes, the wind will drop and there may be a period of better weather and clearer skies.
We then expect Cornwall to be hit by Low 986. Low pressure systems often move in a direction parallel to the isobars in the warm sector, so the center of the system will probably pass to the north of Cornwall. The system is currently an open wave low pressure (no occlusion), so it is reasonable to expect it to deepen as it approaches the UK.
As the low pressure approaches, we expect to see high cirrus clouds, lowering and thickening to cirrostratus, altostratus, stratus and nimbostratus. It may rain as the warm front passes. As the depression approaches, wind will increase in speed from the south / south-west
As the warm sector passes, we expect westerly winds, low cloud and possibly poor visibility.
The cold front may be more rain, followed by clearing skies and a wind shift to the north west.
2.5 Environmental clues
2.5.1 Wind direction
It’s fairly straightforward to determine wind direction if you’re standing in the wind, but we often find ourselves starting the day in a sheltered location, or a place where the effects of the land may affect the local wind. Some indications of wind out on the water might be:
Flags flapping in the wind
Boats swinging on their moorings to face into wind - although the effects of tide sometimes need to be considered
Birds tend to take off into the wind
2.5.2 Clouds
People with local experience and some knowledge of meteorology can tell a lot from looking at the clouds in the sky. For those of us with less experience, there are still some clues to be gained from the clouds - it’s fairly obvious that blue cloudless skies imply fine weather and dark brooding clouds are a portent of imminent rain. Perhaps most useful is the ability to compare the clouds in the sky to the weather forecast - if the clouds arrive earlier than forecast, this implies that the other forecast changes (e.g. wind, rain), may also occur early. Beyond this, some knowledge of meteorology, like the structure of depressions and the ability to understand synoptic charts, is helpful in understanding clouds.
We can classify clouds by:
How high they are - low clouds form below ~6,500 feet, middle clouds from 6,500-23,000 feet and high clouds from 16,000 to 43,000 feet.
Their shape - do they form layers (layer clouds are called ‘stratus’) or clumps (clumpy clouds are called ‘cumulus’)
Do they bring rain? Rain clouds are generally quite tall (often extending between the low/middle layers described above), and have dark/grey undersides due to blocking the sun’s rays. These clouds have nimbo/nimbus in their name - e.g. ‘nimbostratus’ (a rain bearing layer cloud), ‘cumulonimbus’ (a tall puffy thunder cloud).
2.5.2.1 High clouds - Cirrus
The highest clouds in the sky. forming at 16,000 to 43,000 ft are known as ‘cirrus’. These clouds are made from ice crystals and appear white and wispy
Cirrus indicates moisture in the upper levels of the atmosphere. Cirrus can be the first sign of the arrival of an Atlantic depression - indicating that rain and winds are likely in 10-15 hours. The more dramatic the cirrus clouds the more likely it is that stormy weather is on the way.
The lines of cirrus clouds indicate the direction of the high level wind, and thus the direction in which the approaching weather is coming from. The high level wind will normally be coming from a westerly direction. If you can see these clouds move fairly easily, that’s a sign of a strong jetstream and likely high winds to come.
The high level wind wind may well not be in the same direction as the wind at the surface. The difference between the two can tell you whether change in the weather is likely via the crossed winds rules:
With your back to the surface wind, if the upper winds (or cloud movement) comes from the left, then the weather is likely to get worse
With your back to the surface wind, if the upper winds (or cloud movement) comes from the right, then the weather is likely to improve
If surface and high winds align, the weather may not change
These rules come from consideration of the conditions in a low pressure system - the surface winds will blow close the the isobars, whereas the high-level jet-stream winds will blow west to east over the top of the system.
Wispy cirrus clouds may be followed by a high-level cloud that forms as a layer, rather than as individual streaks. This is cirrostratus - a milky veil of ice crystals. This cloud won’t block the sun or moon, but may produce a ring halo around it.
Cirrus followed by cirrostratus is a clear sign that the poor weather associated with a low pressure system is on its way - expect stronger winds in 3-8 hours and rain in 6-12 hours.
Cirrocumulus - small, puffy high clouds - is a very rare cloud type - altocumulus can look similar and is rather more common. It’s not especially useful for predicting weather in any case.
2.5.2.2 Middle clouds - Alto
The middle layer of clouds, forming at 6,500 to 23,000 feet, are given the prefix ‘alto’. Like cirrostratus, altostratus is a layer cloud. As well as being lower, altostratus is thicker. It may be possible to see the sun through altostratus, but it will appear ‘watery’, or as if seen through thick layers of ground glass.
![]()
Altostratus, especially if it gets thicker and lower, is a sign of imminent rain. It is not the altostratus itself that brings the heavy rain, but the nimbostratus that often comes behind it. Ragged lumps of grey cloud below the altostratus layer, called pannus, form from moisture in the air due to rain that is falling but not yet reaching the ground. If you see these clouds, rain is imminent.
Altocumulus clouds are at a similar level, but broken into smaller cloud fragments.

Altocumulus is a somewhat ambivalent cloud. It indicates a degree of instability due to rising warm air, which may develop into rain from a front or local showers. However, it could equally likely remain fair. Perhaps the best advice is to keep an eye on the sky to see if the altocumulus consolidates into altostratus, or if thick cumulus starts to build below it.
2.5.2.3 Low layer clouds - Stratus
Low clouds form below 6,500 feet. We’ll focus first on the low layer clouds - stratus and its variants. These lower clouds will block out the sun. Stratus is a flat sheet of grey cloud.
Stratus can be associated a warm tropical air mass. It may bring drizzle if especially thick, but not heavy rain.
Stratocumulus refers to a range of clouds that are similar to stratus but more clumpy.
Much of our clouds are stratocumulus of some variety. In winter, high pressure systems can be associated with dense stratocumulus.
Dense, thick and dark stratus clouds can bring rain. Such clouds are called ‘nimbostratus’.
Nimbostratus may appear similar to low, dense stratus, or lowering altostratus… but the differences are somewhat academic - when the rain starts to fall, you can safely state that you have nimbostratus above you.
2.5.2.4 Cumulus clouds
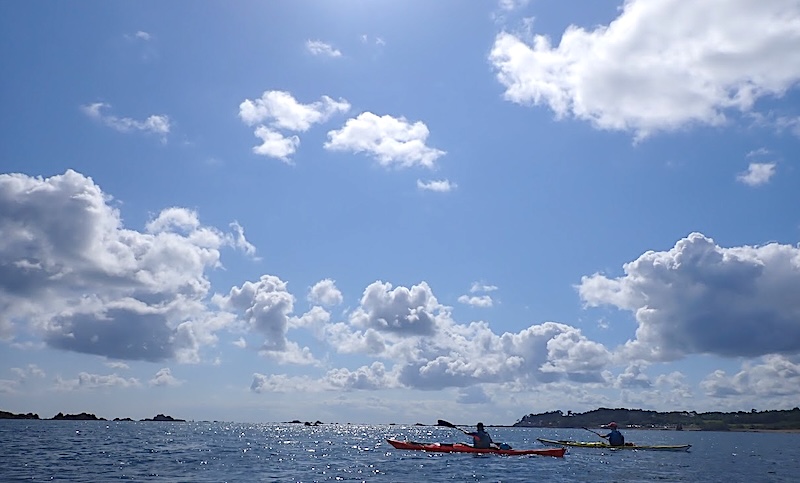
Even in the fair weather caused by high pressure systems, there may be some clouds in the sky. As the sun shines and heats the surface of the earth, the air above the warm surfaces warms and starts rising. This warm rising air often contains moisture which condenses and forms clouds as it rises. The resulting puffy cotton-wool like clouds that form in the blue sky are known as ‘fair weather cumulus clouds’.
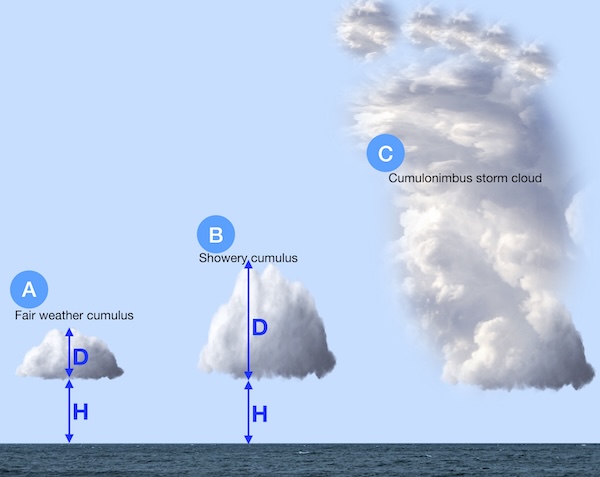
With these fair weather clouds (A in the diagram above), the depth of the cloud (D) is less than the height of the cloud (H).
If the process of warm, humid air rising and forming clouds continues, the cloud can eventually become deeper than its height off the ground (D>H), as shown as B in the diagram above. At this point, the cloud may return its moisture to the ground in a rain shower. It’s likely that this process will happen faster on hot, humid days.
When warm humid air rises unchecked into the atmosphere, the cumulus clouds can become very deep indeed - perhaps 10 km tall! These towering clouds with dark bases are known as ‘Cumulonimbus’, or more commonly ‘thunderclouds’ (C in diagram above). The thunderstorms that they create can produce thunder, lightning, hail and strong localized winds.
If you see fair weather cumulus in the morning, it’s worth keeping an eye on the sky to see if they develop into taller clouds carrying showers, or even cumulonimbus storm clouds, through the day.
2.6 Maritime forecasts
It is useful to be able to interpret the inshore waters forecast issued by the met office. This is available:
- on the Met office website, currently here
- on Radio 4 at 00:48 and 05:20 (long wave and FM) 12:01 and 17:54 (normally long wave only)
- over VHF radio at regular intervals
It is issued for times a day at 00:00 (midnight), 06:00, 12:00 and 18:00 UTC for the subsequent 24 hours.
The forecast includes gales warnings then the general situation for the UK, followed by the area forecasts. Each area forecast contains the following elements, in order:
- Wind strength (Beaufort scale) and direction -e.g. “West 4 or 5, backing southwest 5 or 6 later.”
- Sea state - e.g. “Slight or moderate.” See below.
- Weather - e.g. “Occasional rain later.”
- Visibility - e.g. “Good.”
The forecast contains a lot of information, and it can be read out very quickly. It’s worth having a pen and paper to hand to note down the forecast that you need. I sometimes write the forecast onto the deck of my boat using a grease pencil if I hear it whilst I’m on the water.
Some of the terms used in the forecast are explained in more detail below.
Timing - the words used have precise meanings:
- Imminent: within 6 hours
- Soon: 6-12 hours
- Later: >12 hours
Sea state - innocuous sounding sea states can cause problems for kayakers:
- Calm: <0.1 m wave height
- Smooth: 0.1-0.5 m
- Slight: 0.5-1.25 m
- Moderate: 1.25-2.5m
- Rough: 2.5-4m
Visibility
- Good: > 5 nautical miles
- Moderate: 2-5 nautical miles
- Poor: 1 km to 2 nautical miles
- Very poor / Fog: < 1 km
Changes in wind direction
- Veering: the wind direction will shift clockwise
- Backing: the wind direction will shift anti-clockwise (note that bACking has the letters ‘AC’ for anticlockwise in it)
- (Becoming) cyclonic: the wind direction will change considerably as a depression passes overhead
The map shows the places referenced to define the areas of the forecast. The forecast areas extend 12 nautical miles offshore. Bear in mind that this does make the area that the forecast applies to quite large and the forecast will tend to give the worst conditions likely within that area. Most modern forecast apps will give you much greater detail than this.
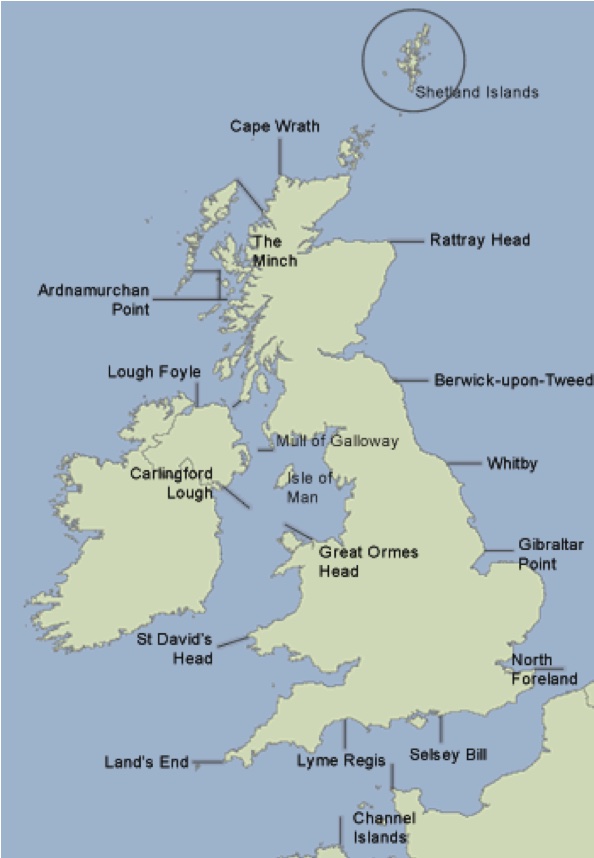
You hear the following over your VHF:
‘The inshore waters forecast, issued by the Met Office at 05:00 UTC on Tuesday 2 June 2017 for the period 06:00 Tuesday 2 June to 06:00 Wednesday 3 June. St Davids Head to Great Orme Head, including St Georges Channel. 24 hour forecast: West 3 or 4, backing southwest 6 or 7, later. Smooth, becoming moderate later. Rain later in north. Good, occasionally moderate later.’
How does this affect your paddling plans on Anglesey?
The weather for today’s paddle seems reasonable for a competent group, but we might choose to start the day paddling westwards into the wind so we can be blown home. We expect less than 0.5 m waves. Visibility should be at least 5 miles.
The weather ‘later’ - i.e. after 18:00 UTC or 19:00 British Summer Time sounds decidedly worse, but we’ll be off the water by then. The wind overnight would make paddling difficult, as would the waves up to 2.5 m. We’d expect rain, which will limit visibility to 2-5 miles.