4 Surf and Swell
4.1 Introduction to surf and swell
4.1.1 The life story of a wave
This section of the notes is about waves. We’ll follow waves from their formation to the point where they break onto a shoreline.

We’ll look at:
Wind waves: waves form when the wind blows across the sea. Although you can get a feel for what happens by blowing across your mug of tea, the processes by which this occurs are remarkably complex. But we’ll be focusing on the results - how the waves produce depend on wind speed and other variables
Ground swell: if there isn’t any land in the way, waves can travel long distances away from the storms that form them. Waves that travel away from the area that they form in are called ‘swell’. We’ll look at what happens as swell travels across oceans
Swell and surf forecasting: where to obtain forecasts of waves and how to interpret them
Waves and topography: what happens when waves enter shallow water and interact with the coastline?
Wind, waves and tidal streams: what happens when waves interact with tidal streams?
Surf: at the end of the wave’s journey it breaks onto a shoreline. How does this happen and how does the quality of the surf depend on the waves and the beach?
Note that we use different terms to describe the waves at different time:
(Wind) waves: for waves that are being formed by the wind (some people might refer to this as a ‘wind sea’)
(Ground) Swell: To refer to waves that travel across the ocean after the wind has stopped blowing
Surf: To describe waves that are breaking onto a beach
4.1.2 Terminology
It’s worth defining a few terms that we use to describe waves. Let’s start with a snapshot of a wave at one moment in time:

The peak (or crest) is the highest point on the wave. The trough is the lowest point.
The vertical distance from trough to peak is the height. Height can be hard to estimate from a kayak. A useful guide is that a kayaker’s eye height is around 1 meter above the water, so if you start to lose sight of the horizon in the trough, the waves are over a meter high.
The wavelength is literally how long the wave is from one peak to the next peak (or, indeed from one trough to the next). Wavelengths vary markedly between waves - a short chop might have a 6 meter wavelength, whereas an ocean swell wavelength might be 350 meters!
Now let’s see what happens as the waves roll past us:
The diagram shows waves moving past a fixed point towards the right. We use a stopwatch to time the duration between successive peaks of the waves passing this fixed point. We call the time that the waves takes to pass, in this case 4 seconds, the period of the wave. You can measure the period of the waves easily from your kayak by counting the seconds between being on the crests of subsequent waves.
The speed of the waves is simply the wavelength divided by the period. In deep water, the speed of a wave depends on the wavelength. As a result, for a deep water wave, the wavelength is always 1.56 times the period squared. To save the calculations, here’s some examples:
| Period (seconds) | Wavelength (meters) | Wave speed (knots) | Gradient of 2 m wave |
|---|---|---|---|
| 2 | 6 | 6 | 0.3 |
| 5 | 39 | 15 | 0.05 |
| 8 | 100 | 24 | 0.02 |
| 10 | 156 | 30 | 0.01 |
| 12 | 225 | 36 | 0.009 |
| 15 | 351 | 45 | 0.006 |
| 17 | 451 | 52 | 0.004 |
| 20 | 624 | 61 | 0.003 |
Notice how for a wave of the same height, the wave gradient is many times less for the long period waves.
4.1.3 Paddling in waves
Obviously, the height of waves has a big effect on our experience of kayaking. The period also has a big effect. Short period waves will throw the boat up and down quickly, making for a bumpy ride and making it more difficult to paddle - it’s easy to ‘miss the water’ with a paddle blade in short period waves. By contrast, long period waves tend to make for mellow paddling conditions - the boat gently rises and falls, but the wave isn’t steep. Paddling in a 3 meter swell with a 15 second period can be a very chilled out experience. Paddling in 1 meter waves with a 2 second period is likely to be more challenging (and probably wetter) experience.
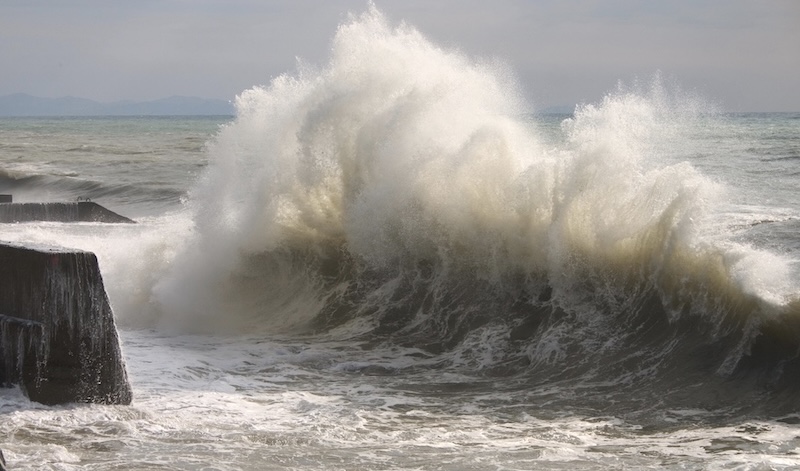
You’ll also notice a difference when long and short period waves hit the shoreline and break. Clearly a higher wave will break harder than a short one - a wave that’s twice as high carries 4 times as much energy. But period has an equally big effect - a 10 second period wave carries 4 times as much energy as a 5 second period one. So, if there’s 15 second swell coming into a shoreline, expect big surf and scary rockhopping.
Generally, short period waves are caused by local winds - you’ll normally experience them when the wind is blowing. Long period waves are always swell from distant storms. We’ll see why this is when we look at ground swell in more detail.
The direction in which the waves are coming relative to the direction in which we’re going will also affect how easy it is to paddle.
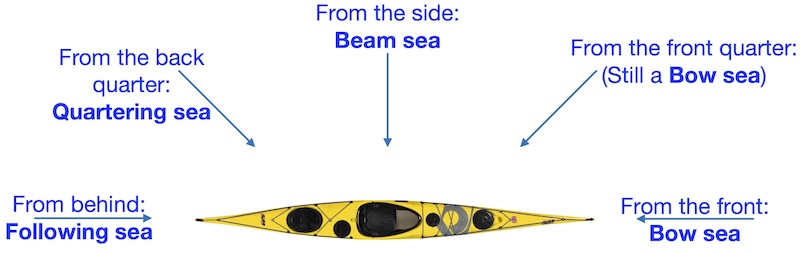
Bow sea: Paddling directly in the waves is fairly straightforward, although we may get a little damp. If the waves are coming from a small angle off the bow, paddling can be a little harder, but the boat is typically not too hard to control.
Beam sea: If the waves are coming from the side, they won’t tend to turn the kayak, but they may make it feel quite unsteady.
Following sea: If the waves are coming from behind the kayak, we cant see them coming, which can make novices feel unstable. Inexperienced groups often suffer capsizes when they turn to put the waves behind them. Kayaks can track straight with a following sea, especially with the skeg down, but a short period sea can make the boat harder to keep going straight. Experienced paddlers can surf waves, whilst novice paddlers will probably be using support strokes - so the group can easily get separated.
Quartering sea: Waves from the back quarter of the boat have all the problems of a following sea with few of the advantages. The boat may still feel tippy to inexperienced paddlers. Keeping the boat straight can now be challenging, as the waves will tend to turn the boat, especially if they are steep short period wind waves.
You’re considering 3 options for trips in the Mounts Bay area of Cornwall:
An open water crossing from Mousehole out to a buoy and back
A surf session at Praa Sands
Rockhopping south from Mullion Cove
How might the following wave forecasts (direction/height/period) affect your choices:
SW/0.7m/4s | SW/0.7m/14s | SW/1.5m/5s | SW/2m/16s
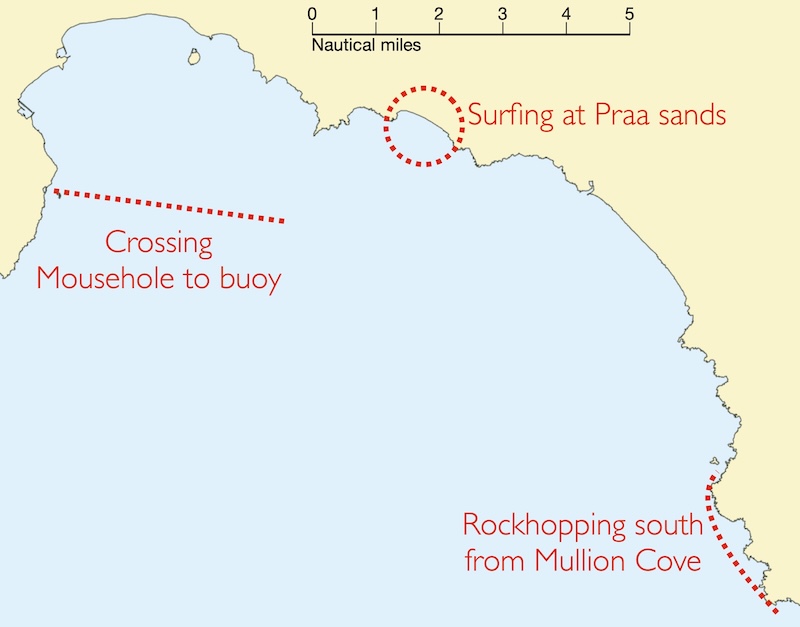
The open water crossing out to the buoy will be awkward in a quartering sea on the way out if the wave period is short. An experienced group might manage in the 0.7m/4s waves, but the 1.5m/5s waves will make this unpleasant for most paddlers. The long period swell is more suitable for this trip - it should be a pleasant journey in either the 14 second or 16 second swell. We may want to look out for any shallow areas where these big waves might break.
The surf at Praa sands will be messy and lack much power in the 0.7m/4s waves, but might still be suitable for a group looking for some rough water practice. The 0.7m/14s waves should create good and powerful surf conditions. 1.5m/5s waves will create messy challenging conditions, best avoided. Whilst the local board surfers will be excited for the 2m/16s swell, this will be too large and powerful for most sea kayakers.
Rockhopping should be enjoyable for a competent group in 0.7m/4s waves. The 1.5m/5s waves will be rather more intimidating, but may create good sport for some groups. 0.7m/14s waves will break powerfully onto the rocks, and care will need to be taken - although keen rockhoppers may relish the challenges and opportunities in the deeper / larger gaps. 2m/16s swell will create very serious conditions, best avoided by most kayakers.
4.2 Wind waves
4.2.1 Wind forming waves
Waves form when wind blows across the surface of the sea. The details of how this happens are complex and, surprisingly, not fully understood.
When waves are very small, the ‘restoring force’ that drives them is not gravity, but the surface tension of the water. These small waves are known as ‘capillary waves’. You can think of the surface of the water behaving a bit like a rubber sheet.
If we disturb the surface of some flat water, for example by dropping a stone into it, some waves will form with a period and wavelength that is characteristic of the properties of the water - specifically its density and surface tension. These small waves tend to have a wavelength of about 1.7 cm - we might say that the surface ‘resonates’ with this wavelength.
When wind blows across a flat sea, there will be some turbulence that causes local areas of increased pressure. The location of these small impulses will be random, but because the water surface has a preferred ‘resonant’ wavelength, the impulses that reinforce the 1.7 cm waves will tend to build up the wave height, while those that don’t will have a lesser effect.
Once some waves have started to form, the wind can push on them to increase their size further. This happens through several mechanisms:
The wind blows on the windward side (front) of the wave, pushing it along and piling more water up.
The wind curves over the top of the wave, almost like it might curve over the top of an airplane wing. The resulting low pressure pulls the wave peak upwards.
The wind eddies behind the wave, pulling the wave along, and pushing down on the trough.
Clearly, all of these effect will be more pronounced on bigger waves. As a result, a positive feedback effect occurs - as the waves get bigger, the wind can act on them more strongly, making them bigger still. As a result, the waves grow exponentially.
Eventually, a limit is reached at which the waves can’t get any bigger for the speed of the wind - one mechanism is that the waves eventually move at (or faster than) the speed of the wind.
One final, and rather strange, effect occurs whilst this is going on. The waves interact with each other to produce waves with longer wavelengths. One of the results of this is that many of the waves actually end up travelling faster than the wind by about 17%.
The size of the waves that are formed depends on:
The wind speed
How long the wind has been blowing over the sea
The plot below gives a feel for how wave heights might grow with time for a few different wind speeds:

As we’d expect, as the wind blows for longer, the waves get higher. But for any wind speed, a limit is reached when the waves stop growing. This is known as a ‘fully developed sea’. The time taken to get to this stage depends on how strong the wind is blowing.
4.2.2 Fetch
The time for which the wind has blown across the sea might be limited by:
The weather conditions - it might only be an hour since the wind started blowing, or the wind direction may have changed
The distance that the wind can blow across the water - this is known as the fetch. If there’s only 10 km of sea upwind of you before the next bit of land, that limits the time the waves can be blown by the wind until the waves reach you.
The image below illustrates waves increasing with fetch as the wind blows across a body of water:
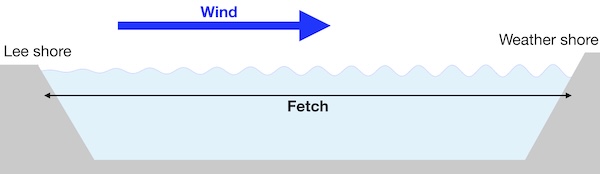
Clearly, paddling conditions will be very different on the sheltered ‘lee’ shore and the exposed ‘weather’ shore. On the lee shore, the water will be flat, and the land may provide some shelter from the wind. The weather shore offers no shelter and the waves may be significant, depending on the fetch. Obviously, a group journeying along a lee shore need to take care - if they stray offshore, conditions will become continually more difficult, and getting back to the shore may be challenging.
The fetch can have a big effect on the waves that we experience. The plot below shows roughly how wave height varies with wind speed and fetch:
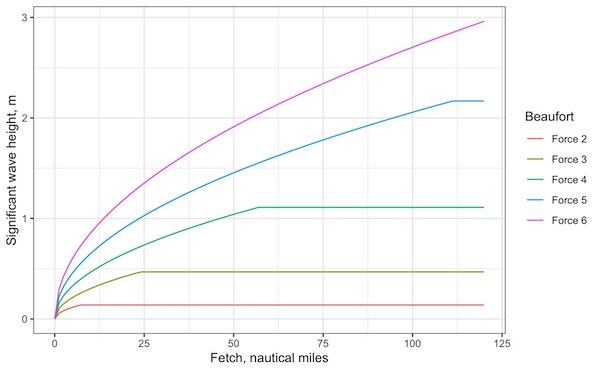
We see a similar pattern as we did on the previous plot. Stronger winds create bigger waves. As the wind blows over the sea for a longer distance, the waves get bigger, but eventually a limit is reached - the fully developed sea state.
What waves might you expect at Keppoch Point on the east side of the sound of Jura with a force 4 wind:
From the south-west?
From the north-west?
From the north east?

If the wind is blowing from the south-west, there is nothing to block the waves between Keppoch Point and the north coast of Ireland - a fetch of about 50 nautical miles. Over this distance, we’d expect the force 4 wind to have created an almost fully developed sea state, with waves a bit bigger than a metre.
If the wind is blowing from the north-west, the fetch is much less due to the Isle of Jura about 10 nautical miles in this direction. We’d expect smaller waves - perhaps a bit less than half a metre.
If the wind blows from the north-east, the fetch is zero - the sea being sheltered by the land. We’d expect the sea to be flat if this wind is the only consideration.
The table below gives the fetch and duration required to raise a fully developed sea for different wind speeds. It also gives typical wave heights and periods for the fully developed sea.
| Beaufort | Wind speed, kt | Fetch to fully develop, nautical miles | Time to fully develop, hrs | Typical wave height, m | Typical wave period, s |
|---|---|---|---|---|---|
| F3 | 9 | 25 | 7 | 0.5 | 4 |
| low end F4 | 12 | 50 | 10 | 1 | 5 |
| high end F4 | 15 | 70 | 12 | 1.5 | 6 |
| F5 | 19 | 120 | 15 | 2.4 | 8 |
| F6 | 25 | 220 | 20 | 4 | 10 |
| F7 | 30 | 300 | 24 | 6 | 13 |
4.2.3 Time to drop off
When the wind stops blowing, the waves don’t disappear. They don’t get any bigger, but they will keep moving in the direction they were moving in until they reach a shoreline.

How long it takes for the waves to drop after the wind stops blowing will depend on how strong the wind was and on the fetch. A very simple rule of thumb is that the waves might become small after a time in hours equal to the fetch (nautical miles) divided by 4. So, in our example above with a 50 nautical mile fetch, it might take 12 hours for the waves to drop. Clearly if the fetch is long, we might expect there to be significant waves for a day or two after a strong wind has stopped blowing.
If the waves generated are large, they can keep moving across the ocean for a very long distance - so that we might experience waves generated by distant winds that never affect us directly. We call these waves ‘swell’, and we’ll now look at them in more detail.
4.3 Ground swell
4.3.1 What is swell?
Storms (i.e. depressions / low pressure systems) over the ocean with high winds can produce high waves. Once the storm dissipates, or moves away, the waves keep moving across the ocean surface. Waves that have been caused by a distant storm rather than local winds are know as ‘ground swell’ or simply ‘swell’.
4.3.2 How does swell work?
At this point, it’s worth us taking a moment to think a bit more about water waves and how they work. A wave is a disturbance in the water surface. When we say that a wave moves across the surface of the sea, what is actually moving is this disturbance and the energy associated with it - not the water itself. This may seem odd - but here’s a simple analogy - imagine an athlete holding the end of a rope and moving it up and down:

Clearly, there are waves moving along the rope. But the rope is not itself moving away from the athlete. In the same way, water waves move across the sea without causing (very much) net movement of the water.
The water movement inside a wave is a little more complicated than the movement of the rope in our analogy. Rather than just moving up and down, the water also moves side-to-side. In the picture below, the arrows show the direction and speed that each particle of water is moving:

Notice that at the crest and trough, the water is only moving horizontally, whereas halfway up the wave slope, the movement is only vertical. And notice how for this 10 meter long wave, there’s almost no movement at water depths greater than 5 meters - i.e. half the wavelength.
It might be easier to think about what happens to individual bits of water as the wave passes. In animation below, we’re following a series of water particles (red dots), as the wave moves from left to right:
Notice that the particles follow a circular path. The circles become smaller with depth - and again, there’s almost nothing happening by the time we get to a depth equal to half the wavelength - 5 meters for this 10 meter long wave.
4.3.3 Swell propagation
What happens to swell as it crosses an ocean? Clearly, the waves that reach Cornish beaches on a summer’s day are different to the chaotic sea state that existed in the ocean storm that formed them. So how do waves become smaller and more ordered? There’s three things going on - they’re known as ‘circumferential dispersion’, ‘radial dispersion’ and ‘dissipation’.
4.3.3.1 Circumferential dispersion
Imagine disturbing the water on a flat lake - maybe by dropping a stone in, or perhaps you’re watching a wriggling swan:
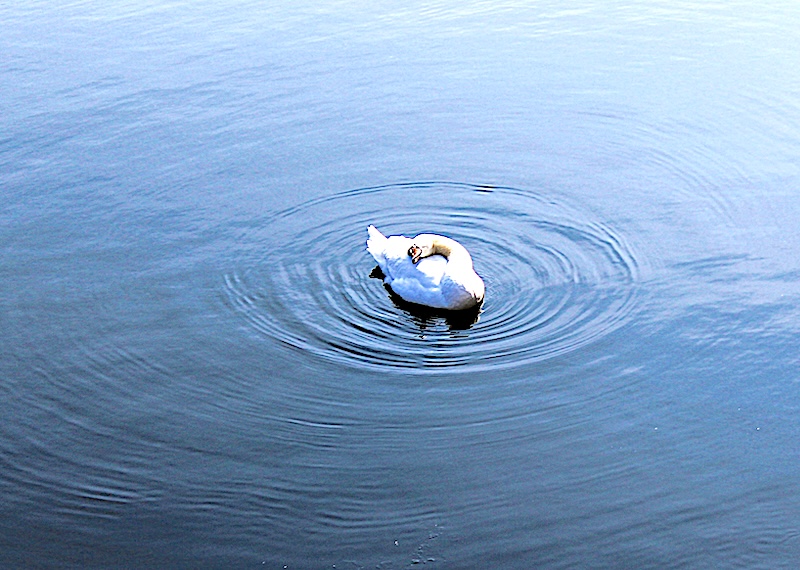
Circular waves form around the swan, spreading out into bigger circles over time. As the waves form bigger circles, they get smaller. This isn’t surprising - the length of the wave crest gets longer, and the energy of the waves spreads across this ever increasing circumference.
The same thing happens to ocean swell as it moves away from a storm:
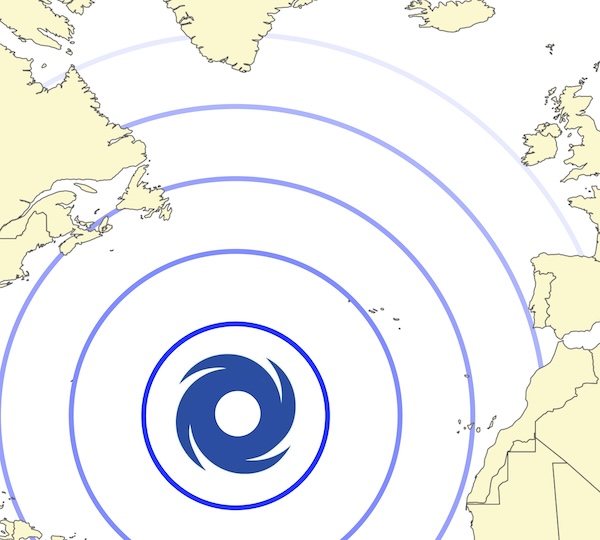
As the waves move away from the mid-Atlantic storm, their crests get ever longer as they fan out. And the wave size drops accordingly.
4.3.3.2 Radial dispersion
The speed at which waves travel depends on their period - longer period waves move quicker. Here’s a few examples:
| Period (seconds) | Wavelength (meters) | Wave propogation speed (knots) |
|---|---|---|
| 5 | 39 | 7 |
| 10 | 156 | 15 |
| 15 | 351 | 23 |
| 20 | 624 | 30 |
(the eagle eyed will notice that the speeds given here are half the wave speeds given earlier - we’ll see why in a moment when we discuss sets).
Storms create a chaotic blend of waves of different heights and wavelengths. As the waves travel away from the storm, the faster long-period waves move quicker than the slower short-period ones. It’s a bit like how runners separate out during a marathon - everyone starts clustered together, but by 20 miles in, the longer-legged runners are out in front, whilst those with shorter strides are left behind.
The diagram below trys to illustrate this in a simplified form. On the left, it shows all the waves in the storm on top of each other - for simplicity waves of period 8, 9, 10… up to 20 seconds are shown:
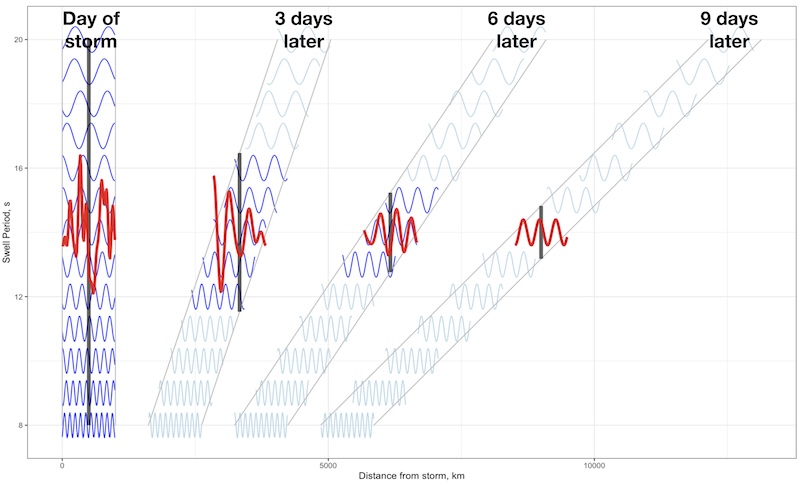
The waves in the storm all superimpose on each other to form a confused sea (red trace).
3 days later, and the long period waves have moved 4000 km from the storm area. But the slower waves have only gone 1500 km. If we take a point 2500 km from the storm centre (vertical black line), we now only see waves from 12 to 16 second periods - the rest are either further ahead or behind. As a result, there’s less energy concentrated into one area of the sea, and the waves have become smaller.
The same thing happens after 6 and then 9 days - notice how less wave periods affect each of the points marked by the vertical black lines, and how the resulting combined red wave trains have got smaller. And the swell has become more organised and regular as the different wave periods separate out.
So we should really update our diagram of the North Atlantic- the energy of the waves doesn’t just spread out circumferentially - it spreads out radially in the direction of swell travel too:
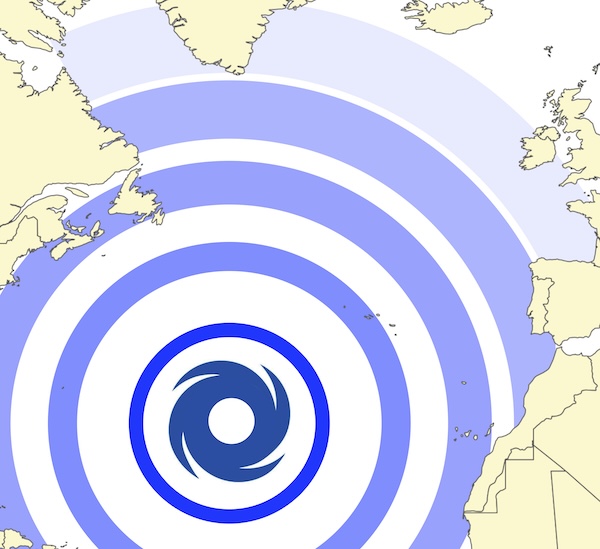
(Note that to avoid the circles overlapping, they’ve been drawn too narrow in this figurative diagram - the plot gives a more accurate picture of the extent of radial dispersion.)
4.3.3.3 Dissipation
So far, we’ve looked at how the energy of the waves spreads out, but not considered whether all the energy of the storm is conserved. Waves do lose some energy as the water molecules rub against each other, and against the air. How much energy is lost and by what processes is still being studied by oceanographers. The surprising thing is how little loss there is, given the vast distances - a swell that’s travelled 8,000 km still retains around half its energy.
The plot below shows how swell heights drop over distance due to the 3 mechanism that we’ve discussed:
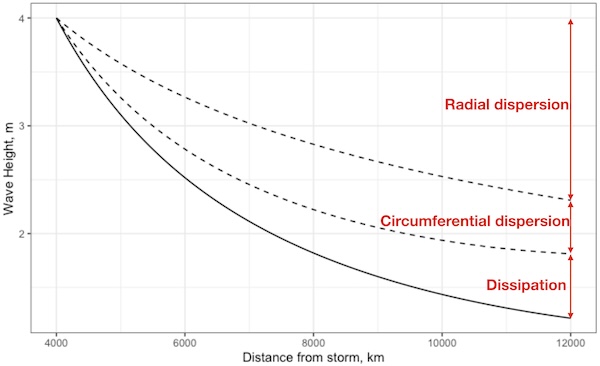
Notice how the wave height initially drops quickly, but then changes much more slowly over remarkably long distances. Most swell will never travel 12,000 km - it’ll hit a shoreline first - but swells have been observed travelling this distance and further from the southern ocean up through the Pacific and as far as Alaska.
4.3.4 Sets
When we looked at radial dispersion above, we briefly considered how waves of different period superimpose to create a chaotic sea. And we saw that far from the storm, the waves sort themselves out so that only waves of a similar period end up travelling together. However, even waves of similar periods will interact with each other to produce more complicated sea surfaces:
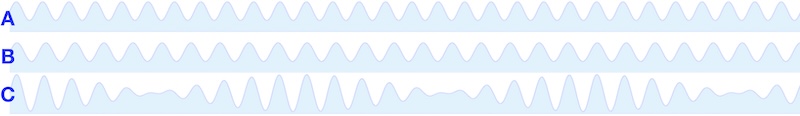
In the diagram, simple wave train A is added to simple wave train B to produce the more complex wave train C. Because A and B don’t have exactly the same period, they don’t line up perfectly. Notice how where the peaks of A and B line up, the resulting waves are large. But when a peak lines up with a trough, the waves cancel out to produce a flat area.
The result is several groups of waves. We call these ‘sets’. You’ll often notice that a set of several larger waves break on the shore, followed by a series of smaller ones. The exact form of these sets (e.g. how many waves are in each, what’s the gap between them) still isn’t well understood, but it can have a big effect on the safety of both surfing and rockhopping.
These sets have some curious behavior if we observe them over time. Here’s a few diagrams of a wavetrain with ~10 second period waves over a period of about 90 seconds:

To make things clearer, one of the wave peaks has been labelled with a blue dot, and the center of one of the sets has been labelled with a red dot. The blue dotted wave starts at the back of one of the sets, then moves forward, reaching the middle of the set around 40 seconds later. It keeps moving forward, but reduces in height and disappears from the front of the set by 90 seconds.
While the individual waves are moving at 30 knots, the sets are only moving at 15 knots - half the wave speed. It turns out that the wave energy moves at the speed of the sets, so that wave trains move across the oceans at the speed of the sets - about half the speed of the individual waves. And waves are constantly appearing at the back of the sets, moving through them and disappearing.

This behavior isn’t normally of direct relevance to sea kayakers, as we rarely see this happening given the time and distance scales involved. However, it becomes important when wave interact with tidal streams. You’ll sometimes see waves form, move through a set and disappear again when wave trains become trapped in tide races.
4.4 Waves and topography
4.4.1 Waves in shallow water
In the previous section we focused on waves in the deep ocean - at at least water deeper than half a wavelength, which we saw was about the maximum depth at which waves disturb the water. What happens when waves enter shallower water?
As the animation shows, the previously circular particle paths are now disrupted by the shallow bottom, becoming longer in the horizontal direction. The wave is now driving water forwards and backwards along the seabed, so it will start to lose energy much faster than it did in deep water.
The wave will slow down, ultimately reaching a speed dictated not by its period but by the water depth. This occurs at a depth equal to around a twentieth of the wavelength:
| Water depth (meters) | 1 | 2 | 3 | 5 | 10 | 20 |
| Maximum wave speed (knots) | 6 | 8.5 | 10.5 | 13.5 | 19 | 27 |
Notice that these speeds get much lower than 30-60 knots that 10-20 second period swell moves at in deep water.
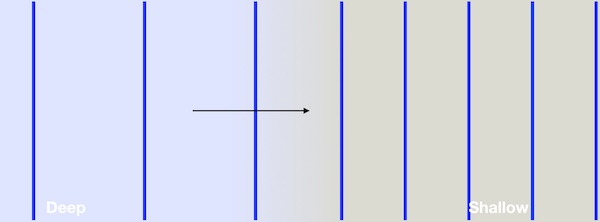
The animation below illustrates what happens when waves slow down as the water becomes shallow:
Notice that as the waves slow down, they have to get closer together - their wavelengths become shorter. And because of this, they become steeper. Here’s a simplified view of the same thing from above - here the blue lines show the wave crests:
We’ll be using similar diagrams to illustrate some of the more complex shallow water phenomena.
When the depth decreases still further - to about a twentieth of the original wavelength - the wave height starts to increase, which makes the waves even steeper.
4.4.2 Refraction and focusing
We now know what happens to waves when they enter shallow water - they slow down and become closer together. In the diagrams above, we showed the waves running along the direction in which the seabed got shallower. What happens when this isn’t the case - when waves move over a shallow shelf or reef that has an edge that’s angled to the direction. of the wave crests?
We know the wavelength of the waves before they enter the shallows, and it seems sensible that once they’re over the shallow areas they have the same wavelength as if they’d approached the shallow area head-on. And obviously, the wave crests need to line up over the step up into the shallows. The only way all this can be true is if the angle of the waves changes between deep and shallow water:

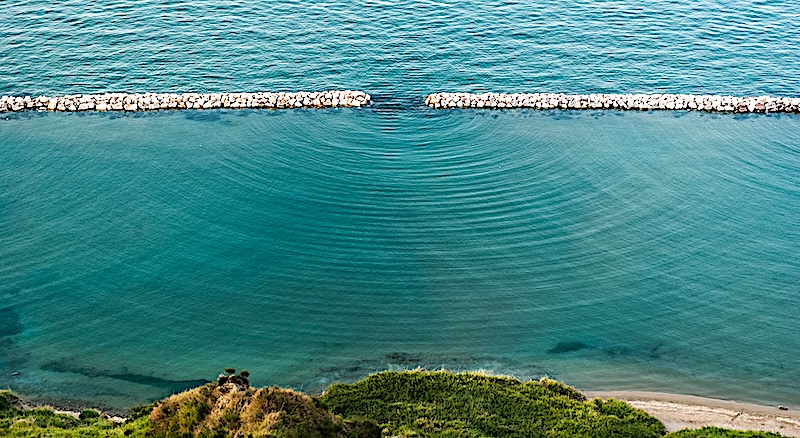
This process, where the waves turn in to shallower water is called refraction. Normally, the seabed gets shallower slowly and the wave crests will bend rather than change directly as abruptly as in the diagram above. This explains why the crests of surf waves are normally parallel to the beach - by the time the wave is in water that shallow, it’s been refracted to face head-on to the beach no matter what direction it came from originally.
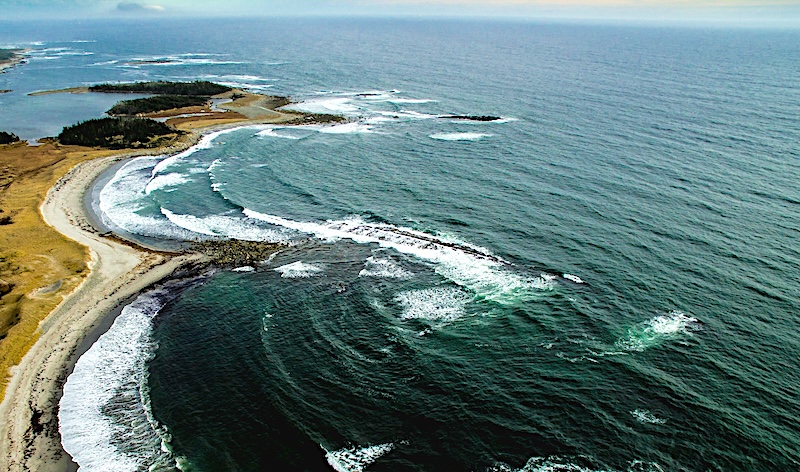
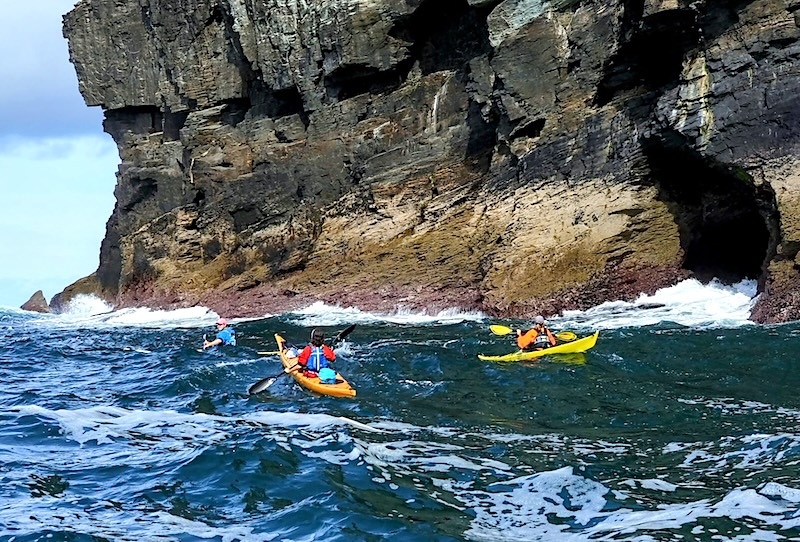
Notice in the image above how the crests of the waves have been bent as parts of the waves refract into shallower water at the edge of the bays. This effect causes the wave energy to spread out into the bays, reducing the size of the waves that break onto the beach. By contrast, waves tend to focus onto headlands as they usually have shallow water around them, creating larger waves at exposed points.
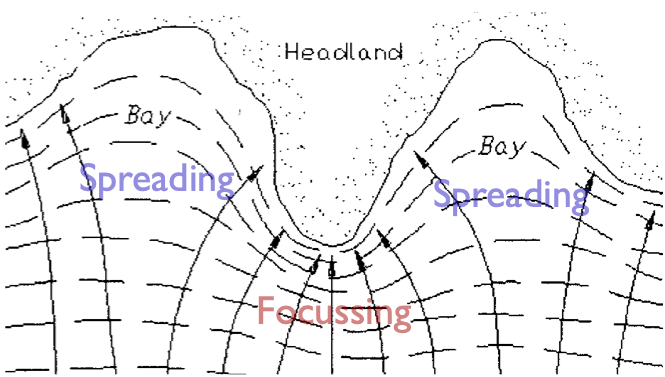
This is one reason why conditions at headlands are often much more demanding than those in the bays in between them. Headlands may also funnel the wind and the tidal stream, further complicating the conditions.
4.4.3 Diffraction
Imagine waves passing through a gap in a breakwater.
It would be strange if the waves passed through the gap and continued in a narrow wave train - think what the edges of those waves would look like - they’d have to be steep walls of water clipped by the edges of the gap. Clearly, gravity will tend to make the waves spread out beyond the gap - as we see in the image above. A similar thing happens when waves pass the end of a pier or a headland:
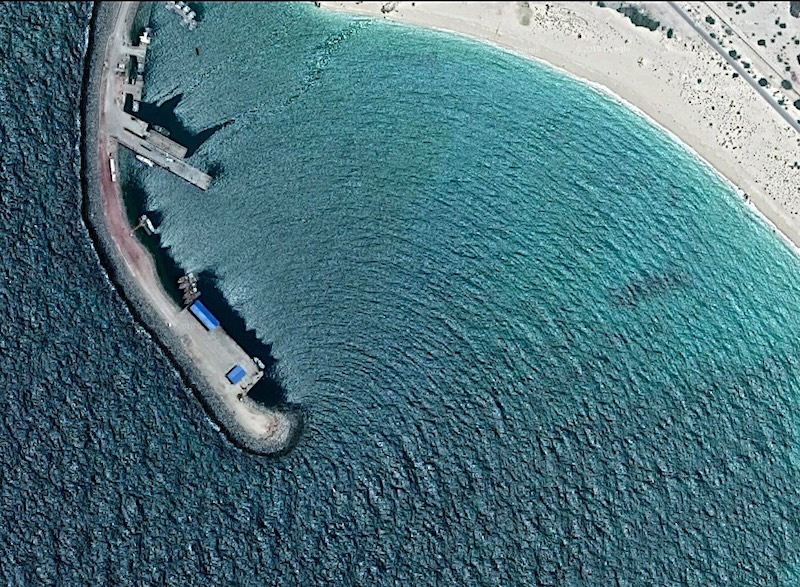
The process by which waves bend behind obstructions is known as diffraction. The result is that there might be less shelter from waves than we expect. However, because the wave energy spreads out as the wave diffracts, the wave will be smaller behind the obstruction.
Let’s look a bit more closely at what might happen in a slightly larger scale example.
A 2 metre swell is coming from the west-southwest along the north coast of Cornwall. What wave conditions might you expect in St. Ives Bay?
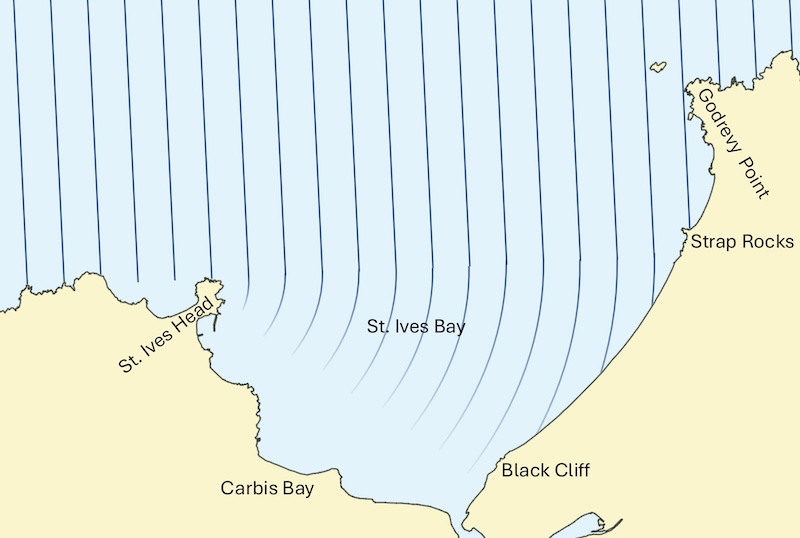
We might expect a swell pattern something like that sketched on the map above. The waves pass St.Ives Head and diffract into St.Ives Bay. We’d expect there to be some areas behind St. Ives Head that are almost completely sheltered - for example, around the harbour to the south of the Head. This shelter might extend down to Carbis Bay, although there may be some small waves here. A long beach extends from Carbis Bay almost as far as Godrevy Point. We’d expect the size of the waves to increase as we head north-east along this bay. By Black Cliff we’d expect some significant waves, with wave size increasing to around full height by Strap Rocks. Godrevy Point will likely have even larger waves due to refraction towards the headland (not shown on the map).
These sort of conditions might be ideal for a kayak surfing session. If you get in at Carbis Bay, you can paddle east until the waves are large enough to be interesting, then either retreat back west for mellower conditions or head further east for bigger waves as you get more confident.
Diffraction of waves depends on wave period. If the swell coming in contains shorter wave periods, we may find that these shorter waves get diffracted less, so that only the longer waves exist at Black Cliff. This might generate cleaner surf than elsewhere on the coastline.
Waves will also diffract around islands. Whilst there will be some shelter from the waves behind the island, further out there may be an area where waves diffracted from either side of the island meet each other and cause a confused wave pattern that may be difficult to paddle in:
4.4.4 Reflection
Waves hitting vertical cliffs will reflect back and interfere with the incident waves. This creates a pattern of larger and sharper waves that can be challenging to paddle in.
When the waves don’t hit the cliff square on, the interference pattern can be more complex, creating a confused sea with a diamond pattern of waves with peaks forming at points:
4.4.5 Reefs and boomers
Waves break when they enter shallow water. Normally, it’s obvious where this will happen - on a beach or against cliffs. Sometimes, waves will break on an underwater reef. This is especially problematic if the depth of the reef is such that only the largest waves will break over it. A paddler might paddle over the reef, not having seen any problems, only to have the biggest wave of the day break over them.
4.5 Surf
We saw earlier how a wave begins to be affected by the seabed when the water depth is about half the wavelength and how waves slow down to a speed dictated only by the depth at water depths of a twentieth of the wavelength. This slowing of the waves brings them closer together and makes them progressively steeper. Ultimately, the wave becomes unstable and breaks.
A range of factors affect when a wave breaks, but it tends to happen when:
The wavelength of the wave reduces to about 7 times the wave height
The depth of the water reduces to around 1.3 times the wave height
4.5.1 Waves and beaches
The way that the wave breaks depends on how steep the beach is:
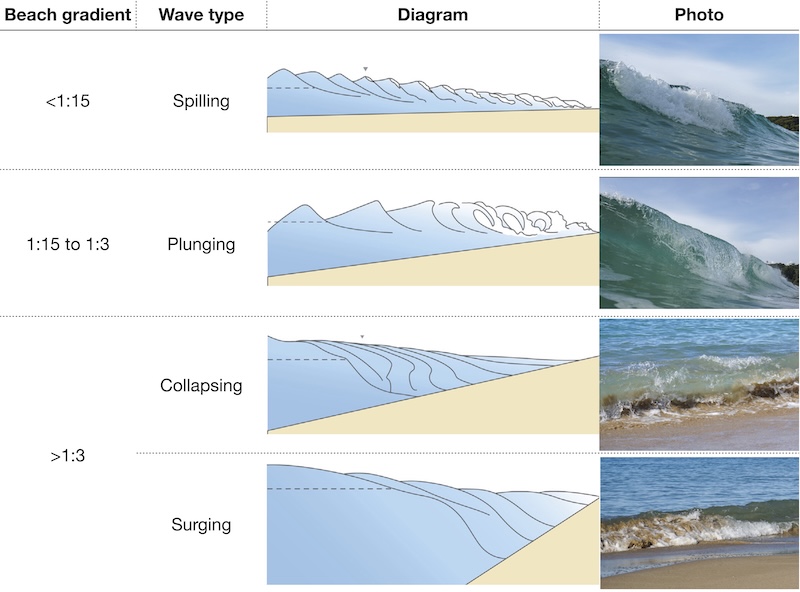
Spilling waves break slowly on beaches with a shallow gradient, losing their energy over an extended distance. These are often enjoyable waves to surf in a sea kayak. On steeper beaches, the waves become steeper too, losing their energy more rapidly. The top of the wave starts to curl over, creating a plunging wave. Plunging waves are sought out by experienced surfers, as they tend to be steep and powerful, but they tend to be challenging to surf into a long sea kayak.
On even steeper beaches, the waves plunge or collapse straight onto the beach, creating a ‘dumping’ wave. These can break powerfully onto a kayak, pin a swimmer to the beach, and possibly pull them under the wave and away from the beach in the undertow that these waves create.
As the beach gets very steep, the waves don’t really break properly, instead they collapse or surge up the steep beach. In both cases the wave loses energy very rapidly, and the surge or collapsing wave can be very powerful.
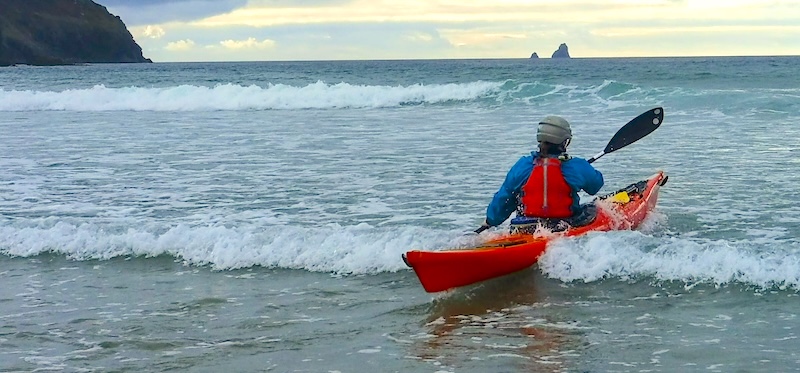
Launching and landing on beaches with spilling waves tends to be fairly straightforward. When the waves start plunging, things get more tricky. By the time they’re dumping, collapsing or surging right onto the beach, launching and landing become awkward in smaller waves and dangerous in larger waves.
4.5.2 Surf height
Remember that as waves move into shallower water, they bunch up and their energy gets concentrated into a smaller area. As a result, surf waves can be taller than the offshore swell. This is especially true of long period waves which have very long wavelengths in deep water.
Here’s a plot that gives a rough estimate of breaking wave height based on swell height and period
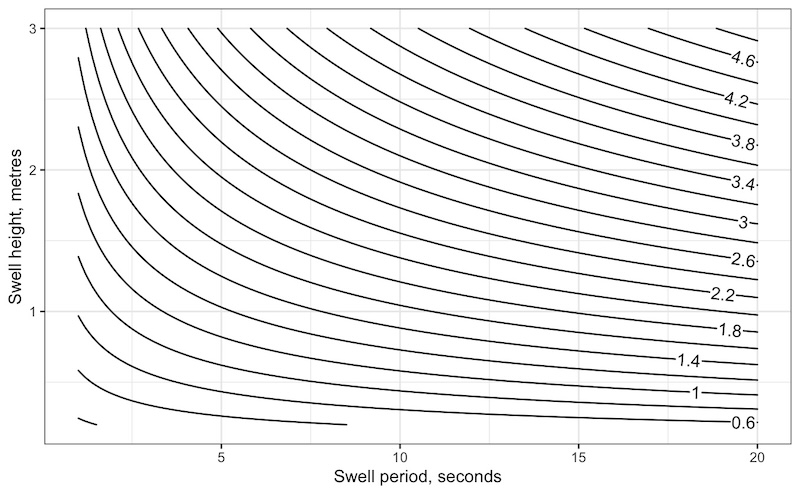
For example, if the swell height is 1 meter and the swell period is 15 seconds, we’d estimate the surf height at 1.8 meters.
Be aware that this is a very approximate estimate that ignores a lot of factors!
Be careful when looking at forecasts of surf height. Often the ‘Hawaiian’ measurement is used which measures the wave from the back - giving a measurement that is half the height of the wave face! It’s a good idea to check what convention the forecast is using.
The surf is affected by any wind blowing across the beach. Onshore winds create wind driven waves that can create confused conditions in the surf zone. The waves break earlier and hence aren’t as steep. By contrast, an offshore wind tends to lead to cleaner surf, with well-defined waves from the underlying swell. The wave break later, becoming steeper and a bit taller.
4.5.3 Surf zone features
4.5.3.1 The surf zone
Let’s look in detail at the final moments of a (spilling) wave before it gets to the beach:
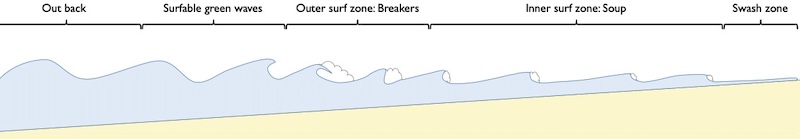
The area beyond the surf zone is sometimes referred to as ‘out back’ by surfers and kayakers. It should be a fairly quiet place to take a rest, regroup after launching through the surf or take a moment to plan a surf landing. The key thing is to make sure that you really are out back - larger waves will break further out and may catch you by the surprise. The waves in this area may still be pushing you gently towards the sure, so staying here might require the odd bit of paddling.
Surf kayaks are fast compared to surfers, and we can often surf ‘green’ waves before they break, starting our rides before any whitewater appears on the wave face. When the waves do break, they sometimes do so at a point, the whitewater extends left and right across the wave face. In this ‘outer surf zone’, the waves can be powerful and change shape rapidly. It’s a challenging, but fun place to surf a kayak, given the right waves.
Once they reach the ‘inner surf zone’ or, colloquially, the ‘soup’ the waves no longer have a defined face. What’s left are piles of broken whitewater rolling in towards the beach. In big surf, it can require some power to punch through these waves. Kayaks positioned side on to these broken waves will get pushed sideways into the beach.
Eventually, the wave swashes up onto the beach. There’s no power left in the wave, but the coming and going of water can make getting into boats and putting spraydecks on awkward.
4.5.3.2 Rip currents
Unlike deep water waves, surf waves carry water along with them towards the beach. This water has to get back out to sea and it sometimes does so through defined deeper channels through the surf zone known as ‘rip currents’ or simply ‘rips’. These currents act over short distances (they usually dissipate in in two to three times width of the surf zone). They pose no great hazard to kayakers - indeed, they can sometimes provide an easy way to get out through the surf with less breaking waves. However, they run fast enough to carry swimmers rapidly out to sea.

Rip currents are not always easy to spot. They can stay permanantly in one place on a beach, or form intermitently. They will be easier to see from the beach than on the water. Look for:
Darker patches of water, indicating greater depth
Areas with fewer breaking waves
Rippled areas of the surface, surrounded by smoother water
Foamy water or sand/sediment being carried out to sea
Rips don’t always show all these features.
Rips can flow directly out to sea, but sometimes flow at an angle to the shoreline. They can often be found at the edges of a beach, by rocky headlands.
A swimmer caught in a rip is unlikely to be able to swim against it. Instead, the right thing to do is to swim parallel to the beach to get out of the current and into an area where the waves will push them back inshore. A kayaker rescuing a swimmer in a rip may also find it easier to paddler parallel to the beach than trying to fight the current with the drag of the swimmer.
4.5.3.3 Longshore currents
Waves don’t always meet the beach exactly perpendicular and the returning water current can have a component parallel to the beach. As a result, there is often a current running along a beach. This current doesn’t normally run very fast, but it can displace groups of kayakers playing in the surf from their start point. To keep the group together, it’s often helpful to pick a landmark on or behind the beach to try and stay opposite.
4.6 Swell and surf forecasts
Swell forecasts are available from many of the places that kayakers use for weather data - e.g. Windy and Windfinder.

In addition, specialist surf forecasts are available that provide similar data on swell, but also forecast what surf this might generate on specific beaches. Surfline is currently one of the best surf forecast sites.
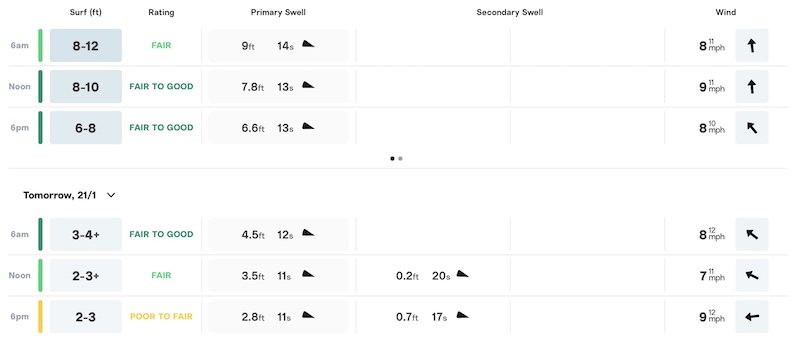
Whilst most of the terms in these forecasts seem self-explanatory, it’s worth digging into them in a little more detail:
Wave/Swell height - Gives an indication of how it might feel paddling in the swell and (together with period), a idea of the power of the wave when it hits the coast. Waves of 1 meter will feel serious to an inexperienced group - this is about the height when group members will sometimes disappear in the troughs. Typically given as the ‘significant wave height’ - the average height of the largest third of the waves. Whilst this measure gives a good idea of how big the waves feel, around 15% of waves will equal or exceed this height and it’s possible to encounter occasional waves of twice the significant wave height.
Wave/Swell period - Rember that period is the time between sucessive wave creasts. As we’ve discussed, long period swell (e.g. 10 seconds or greater) is easier to paddle in than short period (wind driven) chop. However, long period swell implies a bigger wave for a given height, so the effect of the wave breaking will be more powerful. A weaker ground swell will typically have a period of 7 seconds or more. Swell of 10 seconds or more will form substantial surf. 15 second swell is long - the waves are very long, will break heavily on rocks and may form powerful surf.
Wave direction - suggests where we can find shelter. Waves will tend to diffract around headlands, so shelter may be imperfect depending on the shape of the coastline.
Surf height - the height of surf can be given as the ‘face height’ - the height of the front face of the wave from top to bottom - or the traditional/Hawaiian method which is about half this. Obviously, it’s good to check which scale is being used! Surfline defaults to face height for users in most, but not all, of the world.
Wind speed and direction - is often given on surf forecasts, as it has a marked effect on the surf. Surfers often look for offshore winds, as these tend to ‘hold up’ the wave faces, producing clean and tall surf (this description isn’t technically correct - it’s more the absence of small wind-driven waves causing the wave peaks to break early). Kayakers may find such waves rather powerful, and there are obvious dangers to be managed with offshore winds. Onshore winds will create messier surf, but this can often create a safe learning environment for paddlers… and there will likley be less surfers in the water to avoid too!
As with any forecast, a surf forecast won’t be accurate all the time! Variations from place to place and beach to beach can have a marked effect on the surf, as can local weather conditions.
4.7 Environmental considerations
4.7.1 Reefs and gravel bars
We’ve seen how shallows cause waves to break. This doesn’t just happen at a beach - any shallow area in the sea can cause breaking waves. Isolated shallow areas can cause waves to break very suddenly. As a result, paddling in waves when there are reefs, gravel bars or isolated rocks can be ‘exciting’ or ‘dangerous’ depending on the wave size.
Charts can often be used to identify areas with shallows over which waves can break.
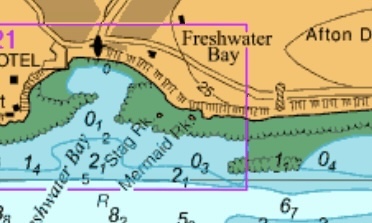
OS maps also show areas between high and low tide, but will not show shallow areas below the low water mark.
4.7.2 Rogue waves
All the waves you encounter on a given day will not be the same. Some will be larger than others!
Remember that a wave forecast will normally give the ‘significant wave height’ - the average height of the largest third of the waves. Whilst this measure gives a good idea of how big the waves feel, around 15% of waves will equal or exceed this height and it’s possible to encounter occasional waves of twice the significant wave height.
Occasional larger waves can cause us a number of issues:
Larger waves will break over shallower reefs - so a reef that we don’t know is there because most waves don’t break over it can suddenly become dangerous. Look out for waves that steepen but don’t break, and consider staying away from places where this occurs.
Rocky landings can be tricky even with normal sized waves, and might be significantly disrupted if a few big waves appear. Watch the landing spot for a few minutes before committing to it.
Rockhopping through gaps, caves, gullies etc is great fun, but many moves will become more dangerous and challenging in larger waves. Observe for some time before committing to a particular move, and keep an eye out to sea in case larger waves start coming in.
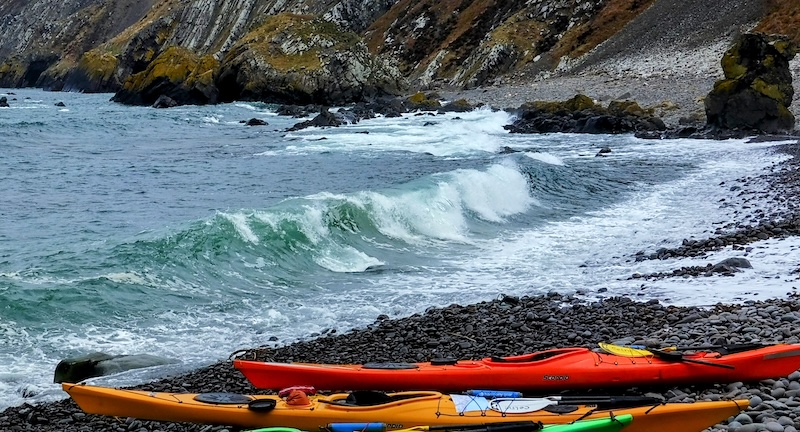
4.7.3 Dumping surf
Remember that on steep beaches, the waves plunge or collapse straight onto the beach, creating a ‘dumping’ wave. These can break powerfully onto a kayak, pin a swimmer to the beach, and possibly pull them under the wave and away from the beach in the undertow that these waves create. Launching from such beaches can be difficult. Landing on beaches with dumping surf creates an obvious hazard, in that it’s hard to see the dumping wave from offshore, and you may end up in a situation where you don’t have an alternative option for a landing at the end of the day.
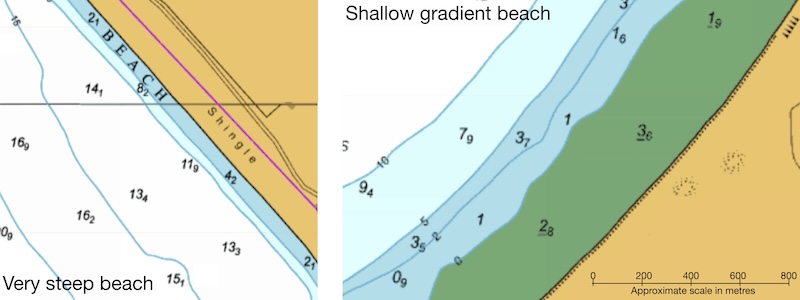
Beaches with shallow gradients typically have a long distance between the waterline at high water and low water. So while they might form nice safe surf, there can be along distance to carry the boat if you happen to be there at low tide. This may enable you to identify shallow angled beaches from a chart or a large scale OS map - look for a large green drying area on the chart. Steeper beaches can be recognised on the chart by the water becoming deep close offshore.
Sometimes the steepness of a beach can vary with the height of the tide. This is worth watching out for - a beach that has a shallow angled lower part and a steeper upper part might be easy to launch from at low tide, but present a nightmare landing spot with dumping waves at high tide.
Note that beaches with dumping surf tend not to feature on surf forecasts - they’re not good places for surfers. This can make it difficult to assess likely conditions before you get the beach.
4.8 Wind, waves and tidal streams
In some areas of the coastline, the tidal stream is faster than others, as we looked out in the notes on tidal streams. As a reminder this can be due to:
Headlands that stick out into the stream and squeeze it sideways - a tide race
Shallow areas that squeeze the flow vertically - an overfall
Both effects happening at the same time - as often happens at headlands that end in shallow areas
4.8.1 Wind and waves against tide
People often talk about ‘wind against tide’ causing a rough sea. In reality, it is the waves created by the wind interacting with the tidal stream that causes rough conditions. It is good to remember that this can happen with any waves - so a race can be rough when there is no wind, but a swell is present.
When waves are going the opposite direction to a tidal stream, they become shorter, taller and often break. This can make for challenging (scary / fun) conditions in tide races and overfalls.

4.8.2 Tide races / overfalls
Let’s dig into more detail as to why this happens by following some waves from still water into a tide race.
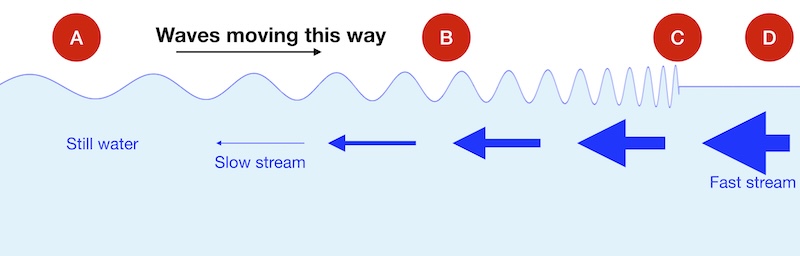
At (A) the waves are in still water, moving from the left hand side of the image towards the right. The tidal stream increases towards the right hand side of the image. As the waves enter the faster stream, they’re squeezed together (B), reducing their wavelength. This has several effects:
The waves become steeper. They may well become so steep that they break.
The wave energy becomes concentrated into a smaller area, so the waves get higher.
The waves slow down.
The waves continue to slow down until they reach a point where they can no longer travel upstream (C). This point is sometimes called the ‘stop line’. Above this point, in the run in to the race (D), there are no waves and the water can be flat.
Of course, in reality, the sea state is rarely a single simple swell like we’ve just looked at. Instead, waves come in many different periods and sizes. Waves of each period will have a different stopping speed and hence will stop at a different point in the race as the flow accelerates. The result is that:
In the lower, slower, part of the race, many wave periods are present. The waves are all being compressed and steepened, so the result is a chaotic mess of breaking waves
As we move up the race, only the fastest waves (longest wavelengths) are left. As a result, the front waves of the race are much more regular and ‘clean’ - this is the best part of the race to surf
Above the front waves, in the ‘run in’ the race may continue to accelerate to a speed greater than the stopping velocity of any of the waves. None of the waves can penetrate onto this fast flow, so the water surface will be smooth. The smooth water may continue above the race when the flow speed decreases.
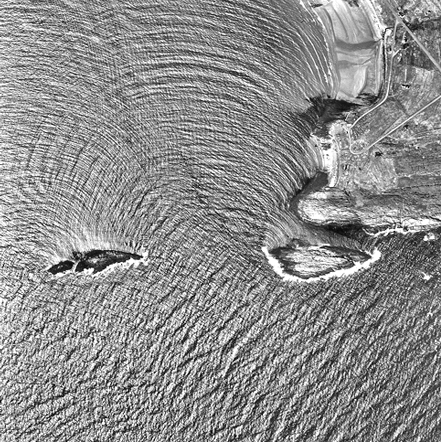
If we look at a race, we can often see these features. The image below shows an idealized diagram of a race and a picture of a small race.
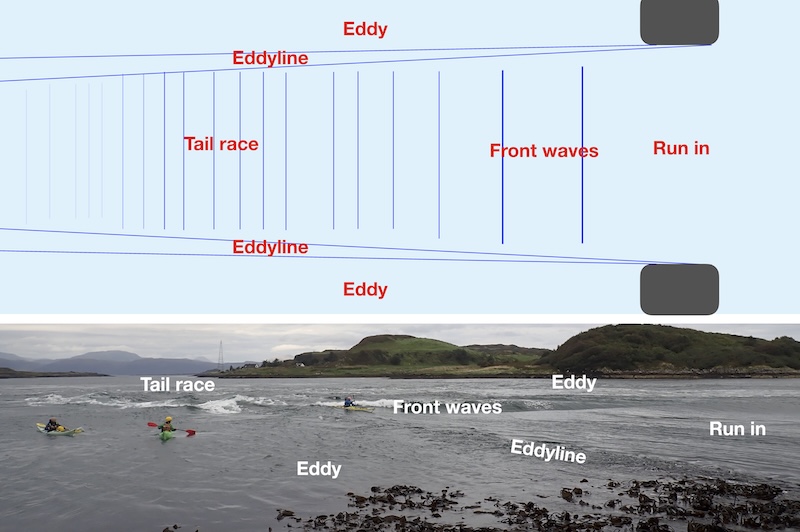
Here we can see the smooth run-in, which no waves can penetrate into and the ordered waves at the front of the race. Further down in the ‘tail race’, the waves are smaller, but more disordered. To make it possible to see all this, I’ve chosen a small race for the image - often these features will be present over a much bigger area.
Actually, there are a number of factors that often contribute to a tide race being rough:
The waves are compressed by the flow, becoming shorter in wavelength and much steeper - and often breaking
The concentration of wave energy into a smaller wavelength causes the wave height to increase, making the waves steeper still
Refraction occurs at the edges of the flow (the part of the wave in the slower water can travel faster, so the wave turns into the flow), concentrating and containing the waves in the strongest flows
Waves with initial (still water) speeds less than 4 times the flow speed are stopped by the flow, and can be reflected back down the race, increasing the chaos
4.8.3 Wind / waves with the tide
Sometimes, we see waves (and/or wind creating waves) that move in the same direction as the tidal flow. When this happens, the waves get stretched out by the flow, and the sea can be very calm.