1 Navigation part 1
I’ve chosen to split the Navigation modules into two parts:
Part 1 (this part) introduces maps and chart, and how to use them to plan trips by measuring distances and calculating times. We’ll use these basic skills in many of the other modules as a foundation for trip planning.
Part 2 covers how to find your way around on the water - working up from simple coastal navigation strategies to how to carry out short crossings in tidal water.
Navigation isn’t just about finding out where you are - it’s about planning where you’re going. Decision making, both before you go out, and on the water, requires taking a lot of factors into account - for example:
The weather: are conditions suitable for a day on the water? Do we need to seek shelter? Is is better to start by going upwind so we can get blown back at the end of the day? Will the weather change whilst we’re on the water?
Type of craft: This clearly affects how far we might be able to go, and where it is sensible to go. Weather and sea conditions affect different craft in different ways - for example, an offshore wind may be more problematic for a group of SUP paddlers than a group in sea kayaks.
Experience: How experienced and skilled the group are
Leader: The experience of the group leader (if there is one)
Fitness: How far do we want to go? Do we have the fitness to paddle in more difficult conditions - paddling in wind and waves requires much more effort than flat water.
Launching and landing: Where can we get on and off easily? Does this depend on the tide
Places to stop: Where can we get off the water for a break or in an emergency?
Car parks: Where can we park near the water?
Aims and aspirations: What do we want to see on the water? What are we looking to achieve?
Notice that many of these factors relate to the geography of the paddle, and we’ll likely discuss them whilst looking at a map.
1.1 Practicalities
1.1.1 On the water
The limited space available on a kayak deck means that we need to give some thought to how we organize ourselves to navigate on the water.
1.1.1.1 Waterproofing
Neither a map nor a chart is much use if it’s soaked in seawater and falling apart. It’s clear that you’ll need to do something to keep your map or chart dry if you’re going to use it at sea on the deck of a kayak. You might:
Place the map in a waterproof map case. Beware - most map cases are designed to withstand a bit of rain, not the complete immersion possible on a sea kayak deck! Many paddlers used to swear by the ‘Axel pack map case’, but this no longer seems to be available. I’ve got no specific recommendations (other than to test whatever you decide to use thoroughly), although Whetman Equipment, who usually make excellent kit, do offer one.
Buy waterproof maps and charts. OS maps are available laminated, but these are only described as ‘weatherproof’. Some Imray charts are available laminated.
Laminate them yourself. This is time consuming, but allows you to cut your maps and charts to the size you want, and make use of printouts where these are available.
Given that neither laminating or map cases can be relied on to be perfectly waterproof, I’d suggest using both methods - placing laminated maps in a waterproof map case. Another advantage of laminated maps is that you can make notes on them with OHP pens - these notes can later be removed with isopropyl alcohol, alcohol wipes or whisky.
1.1.1.2 Carrying maps and charts
Many kayakers place their map under their front deck elastics. I find that a map placed there is too far from me to read, so I prefer to keep my map closer. I use a spray deck with elastics to which I’ve attached a map case.
1.1.1.3 Other equipment for the boat
It’s useful to carry some other navigation equipment in the boat:
A baseplate compass (and ideally, a boat-mounted steering compass)
Chinagraph pencil (and possibly OHP pen) for making notes on maps, or the kayak deck.
A GPS unit - although I rarely use mine, it’s a good backup in poor visibility and it allows position to be given very precisely in the event of needing outside assistance.
It’s useful to keep this equipment to hand - perhaps in a buoyancy aid pocket, or a small hatch in front of the cockpit.
1.1.1.4 My setup
There’s lots of options for how and where to carry navigation equipment when you’re out on the water. Here’s what I choose to do:
I carry laminated sections of map 26cm x 26cm in an Ortlieb map case. This holds the map securely in place and provides 2 waterproof barriers. Whilst the map case isn’t all that waterproof by kayaking standards, I can use a non-waterproof map on sunny days with flat water. It turns out that this size of map can be stored in boxes designed for vinyl records.
The map case eyelets are threaded onto the shock cord of my Peak Explorer spraydeck. A spraydeck mounted chart case keeps the map close enough to be easily readable – for boats like my Cetus that have a small hatch in front of the cockpit, it would otherwise be a long way forward. Also, the map is always with me when I’m out of the boat.
If there’s any substantive navigation to be done, I’ll carry a hiking compass in a buoyancy aid pocket, with the loop of cord attached to the waist strap on the buoyancy aid with a larks foot knot.
My boat has a steering compass - I use it to check my direction when following coastlines as well as when following bearings in open water.
The small hatch in front of me contains a chinagraph pencil, and OHP pen and a GPS unit. The GPS unit only comes out for crossings in fog or when I want a precise and certain grid reference - e.g. for the coastguard. The chinagraph pencil is good for scribbling notes on the boat - especially when listening to weather forecasts over VHF.
1.1.2 On dry land
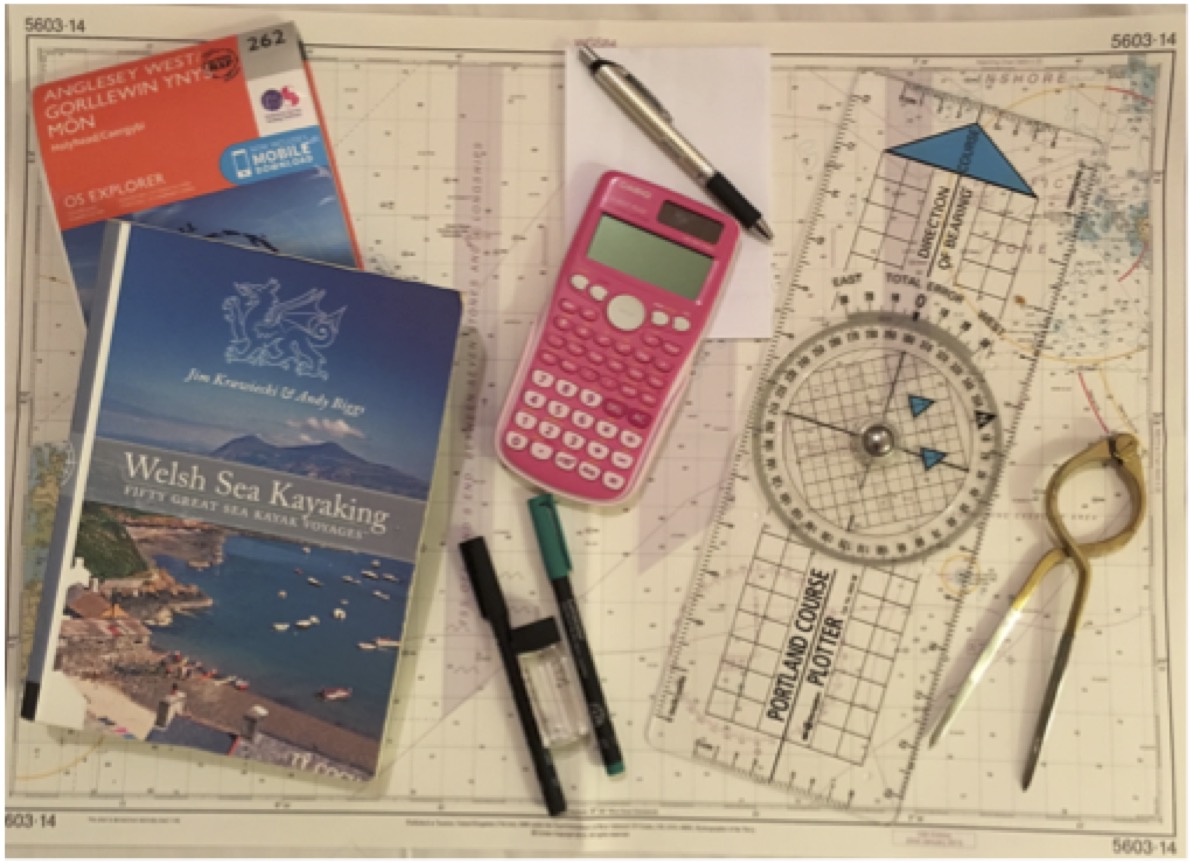
In addition to the simple equipment carried in the boat, it is helpful to have some items with you on the trip for evening planning. These might include:
- Larger maps and, possibly, nautical charts to give an overview of the area
- Sources of tidal (and other) information – tide times, alamanacs, pilots, kayaking guidebooks etc.
- Portland plotter (like a big hiking compass, only really necessary for advanced work)
- OHP pens for marking up laminated maps
- Isopropyl alcohol (or whisky!) to remove OHP pen annotations
- Pen, pencil and scrap paper for tidal calculations
- Calculator (if mental arithmetic is poor and you want to be precise)
- Smartphone – great for weather forecasts and tide times.
1.2 Maps and Charts
Sea kayakers use two sorts of maps – normal ‘hiking’ maps (mostly produced by the Ordnance Survey in the UK) and nautical charts.
1.2.1 Comparing maps and charts
For comparison an OS map and a nautical chart of the same area are shown below:
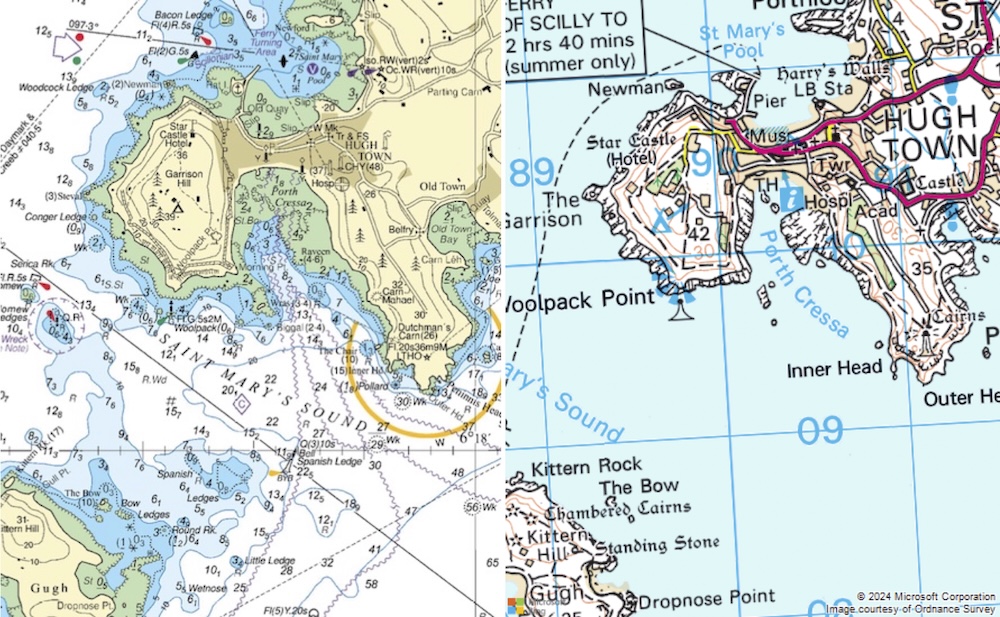
Notice the difference in emphasis between the maps. The OS map shows great detail on the land, but shows the sea as a uniform blue. By contrast, the chart shows only basic detail of the land (only the features easily identifiable from the sea), but gives much more information about the sea.
The advantages of charts are that they show:
- Details on the depth of the seabed, which is useful in understanding likely conditions and important if falling tides might expose significant areas.
- The positions of buoys and other navigational marks – useful especially for navigation across open water and at night when these are lit.
- Tidal information.
- Greater detail of the exact shape of the coastline and islands, if a large enough scale is available.
However, the chart is useless for navigating on land to find the put in, or in case of an unplanned landing. Also, close in to many coastlines, large-scale OS maps (especially the 1:25,000 series) show many details that can make navigation easier for a kayaker. OS maps are also more readily available than charts.
1.2.2 Reading charts
Nautical charts use a bewildering array of symbols to convey information. The full list is found in a book ‘Symbols and Abbreviations Used on Admiralty Paper Charts’, also known as ‘Chart 5011’. However, sea kayakers only need to know a small proportion of these symbols.
Land on charts, above springs high water, is colored yellow. Deep sea appears as white, with blue used for shallow areas. Green is used to indicate parts of the seabed that can dry out at low tide, but which are covered at high water on a spring tide.
The numbers that cover a chart are depths. Underlined numbers are drying heights – i.e. how high that place will be above the water at a low tide. Both depths and drying heights are measured with respect to the ‘chart datum’ - generally the level of the lowest possible (astronomical) tide. The chart datum is the same as the zero used for tide tables.
Wiggly lines on charts, looking like waves, are used to indicate areas of rough water. Arrows are used to indicate tidal stream directions. Buoys are illustrated on charts using symbols that look like the shape of the buoy.
1.2.3 Which to use?
In practice, I tend to use 1:50,000 OS maps for most simple coastal navigation. I’ll think about using a chart instead when:
- I’ll be leaving the coastline - e.g. paddling between islands, or especially if I’m making an open crossing - tidal information, and marking of buoys becomes useful
- When the available charts for the area contain a lot of information useful to sea kayakers - mostly tidal stream information, or buoys useful for navigation
- When charts are available at useful scales (e.g. 1:50,000 or larger)
- When information on drying heights is useful - i.e. in areas like estuaries or shallow reefs where the area I want to paddle sometimes becomes dry land
- When I don’t need fine detail for navigating along the coastline.
In general, it’s possible to use either OS maps or charts for most purposes, especially if you mark up your OS map with tidal information and the odd useful buoy.
The one occasion when I will always use a chart is when navigating through areas with lots of other boats and large ships (e.g. Portsmouth Harbor, much of The Solent, Firth of Forth). In these places, it’s critical to know where the shipping lanes are and what landmarks harbormasters are referring to over the VHF. Buoys are often numerous and become essential for navigation if you’re doing anything other than hugging a shoreline.
In summary, 1:50,000 ‘Landranger’ OS maps are a great choice for most purposes, and will be totally adequate for sea kayakers undertaking simple coastal journeys away from busy ports.
1.2.4 Obtaining maps and charts
OS maps are widely available from bookshops and online sellers. The 1:50,000 ‘Landranger’ maps are normally adequate for sea kayaking. The 1:25,000 ‘Explorer’ series has more detail, but it’s only useful if you want to navigate with a level of precision that isn’t normally required. Ebay is a good source of second-hand OS maps.
There are some online sources for OS Maps:
Some sites display OS maps using the OS maps API (e.g. The Hug). The terms of use linked on the map do not permit printing the maps out.
OS Maps is a subscription service that allows you to print OS maps at decent size and quality.
Charts are somewhat more difficult to get hold of. In the UK, charts were traditionally produced by the UK Hydrographic office (UKHO) under the ‘Admiralty’ brand. Whilst the UKHO still produces paper charts, they are now very expensive. Most UKHO charts are rather large, designed for use on large ships. The UKHO also publishes the “ADMIRALTY Small Craft Charts” for small craft users which are better value (especially if you buy many at the same time) and often a more sensible size for the average coffee table. Charts can be purchased from many outlets online - I’ve often used Bookharbour, which has a handy map to help you find the chart you need.
VisitMyHarbour is a website intended for sailors with much useful information (e.g. tide tables, tidal stream atlases) availiable for free. For a very modest one-time charge, you can access the entire set of UKHO charts for the UK.
The other major chart producer for the UK is Imray. When the UKHO announced their intention to discontinue paper charts, Imray said that they would continue to produce them for the foreseeable future. However, they decided against this in 2024 and will stop selling paper charts around the end of 2025. Imray does offer a phone and tablet app, but I’ve not found an online source for their charts.
For yachting, it’s considered essential to have fully up-to-date charts - sailors get particularly worried about newly discovered shallow rocks. Whilst things do change on charts, it’s far less critical for sea kayakers to have the most recent versions. This means we can take advantage of yachties selling their old charts secondhand. Ebay is a good source for UKHO and Imray charts.
Digital charts can be viewed on the Navionics app. Whilst the format is a little less familiar, the detail is impressive, especially if you’re interested in depth information.
1.2.5 Other sources of information
Maps can also be found:
In guidebooks/pilots - whilst these aren’t normally good enough to navigate with, they often contain useful additional information (e.g. tidal streams, get ins…) and can be useful for planning discussions
Google - google maps isn’t great for navigation but can be superb for finding get-ins and scoping them out using Streetview.
Other useful sources of planning information are:
Sea kayak guidebooks - for the UK Pesda Press has produced a series covering most of our coastline.
Pilot / sailing directions. A comprehensive set are published by both the UKHO (Admiralty) intended mostly for larger boats. Often more useful are pilots written for yachting - Imray publish many, but there are many smaller publishers (e.g. the Irish Cruising Club). Available from the same places as nautical charts.
The Paddle UK Go Paddling website carries a lot of information on places to go paddling around the UK, including the annotated ‘Paddlepoints’ map.
Nautical almanacs, which contain tide tables for the year, as well as much other useful information. I use Reeds Small Craft Almanac.
1.3 Specifying position
It is useful to be able to specify a position exactly on a map or chart. Indeed, this could be of critical importance when informing the coastguard of your whereabouts in an emergency.
1.3.1 Grid references
Many people will be aware of the OS national grid. All OS maps are overlaid with blue grid lines which divide the map into 1 km squares. Numbers along the side of the map allow each square to be referenced.
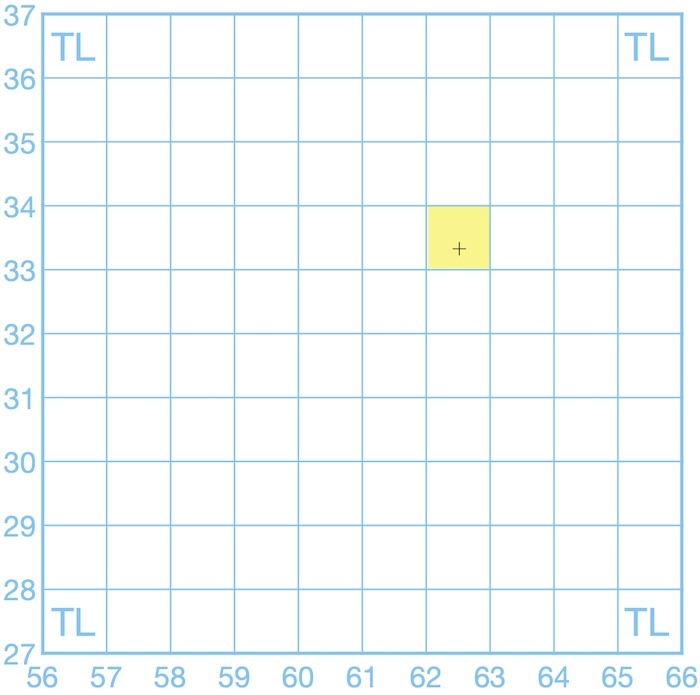
To reference a specific square on the grid we use the numbers to the left of and below the square. For example, to reference the square on the grid above highlighted in yellow, we’d use the number 62 along the bottom of the map (the ‘easting’) and 33 along the side (the ‘northing’). OS grid references are always given with the number along the bottom of the map (easting) first (some people use the phrase ‘bottoms up’ to remember this). So the grid reference for the square is ‘62 33’.
The reference numbers on OS maps only go from 00 to 99. This is a problem as OS maps have to cover the whole country, which is larger than 100 km x 100 km! To solve this problem the country is divided up into 100 km squares, each referenced by 2 letters. You’ll find these letters at the corners of OS maps, or at the edges of the squares, when these appear on a map. Our grid above is entirely in the ‘TL’ 100 km square, so we can provide a gird reference for our square of ‘TL 62 33’. In practice, the letters can be omitted if it’s clear roughly where the location is.
TL 62 33 is called a 4-figure grid reference for fairly obvious reasons. 4 figure grid references refer to a 1 km square, which is quite a large area. We often want to specify location more accurately than that. Because of this, sea kayakers will normally use 6-figure grid references, which specify a 100m x 100m square.
You’ll notice that there aren’t any grid lines spaced at 100 m intervals - they’d make the map look very cluttered. We need to estimate location within the grid square instead. For example, let’s create a 6-figure gird reference for the cross on the grid above. Looking first at the eastings along the bottom of the map, the cross appears about halfway across the grid square. Thinking of 10 imaginary divisions across the grid square, the cross would be on the 5th division, so we append the number ‘5’ to our original easting number to give ‘625’. Looking up the side of the map, we estimate that the cross is about three tenths of the way up the grid square, giving a northing of 333. Our complete 6-figure grid reference is ‘TL 625 333’.
Let’s look at an example on a real map.
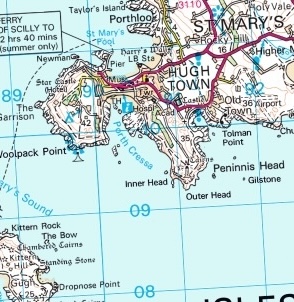
What is the grid reference of the Peninnis Head lighthouse?
Notice that we can’t see the edge of the map here. However, you’ll notice that grid numbers are helpfully printed across the map to make giving grid references easier.
- Two letters that identify the 100 km square – in this case ‘SV’. This would be given on the corners of the map sheet (not shown on the map extract above).
- The ‘easting’ – the ‘horizontal’ coordinate. We use the scale on the edge of the map, which is repeated for convenience across the sheet. The first two letters identify the grid square – in this case ‘91’. For greater precision, we can add a third number to indicate how many tenths across the square the location is. In this case the lighthouse is 1/10 of the way across the square, so the third number is ‘1’ to give a complete easting of ‘911’
- The ‘northing’ – the ‘vertical’ coordinate. Exactly the same as for the easting, but up the map. In this case, ‘093’. Note that we keep the leading zero here to make it clear that this is a 6 figure gird reference, and we aren’t referring to square 93.
The complete grid reference is thus ‘SV 911 093’.
We’d use the phonetic alphabet to say this over VHF: “Sierra Victor nine-one-one zero-nine-three”.
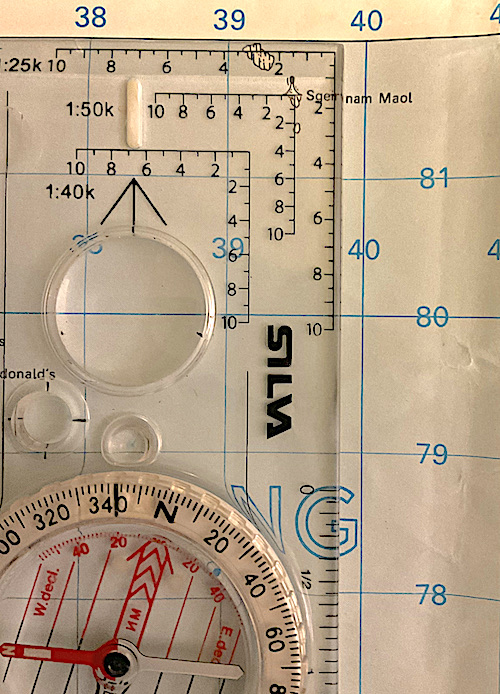
Giving 6-figure grid references is somewhat approximate, but for most purposes estimating the final numbers for eastings and northings by eye is good enough. A tool called a ‘romer’ - a card with graduations matched to the map scale - can be used to improve accuracy. Many hiking compasses feature romer scales at their corners, so if you’re carrying a compass, it’s likely that you can use one if you want to be super-accurate.
There’s no theoretical reason to stop at 6 figures. An 8-figure grid reference specifies position to the nearest 10 meters. It’s hard to read an 8-figure grid reference from a map (although using a romer and a 1:25,000 makes it feasible). However, 8-figure (or even 10-figure) grid references are commonly given by GPS units.
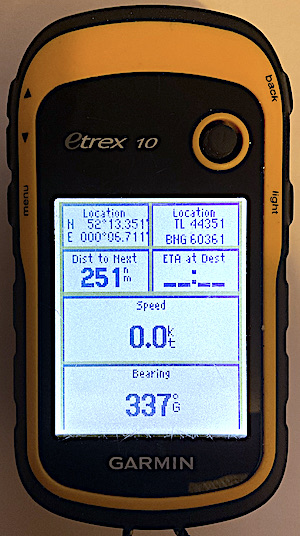
If you end up faced with an abnormally long OS grid reference, simply ignore anything after the first 3 figures of the northing and easting to give yourself an understandable 6-figure gird reference. For example, the GPS unit in the photo above shows ‘TL 44351 60361’. I’ll read off TL 443 603, which is a 6-figure grid reference that I can reference to a map easily.
1.3.2 Latitude and longitude
Nautical charts are designed for use by vessels that might voyage across much of the globe. The OS grid only covers the British Isles, so a more universal system is needed to give positions anywhere in the world. Positions on nautical charts are given as latitude and longitude. It will help to understand how this system works on a global scale before using it to define a position.
The earth can be conceived of as a sphere, rotating about the poles, with a line called the equator halfway between the poles. Latitude and longitude are angles measured from the center of the earth. The equator is defined as the line of zero latitude. The north pole is defined as latitude 90 degrees north and the south pole as latitude 90 degrees south. Lines of latitude run around the earth parallel to the equator and are defined by the angle between the line, the center of the earth and the equator.
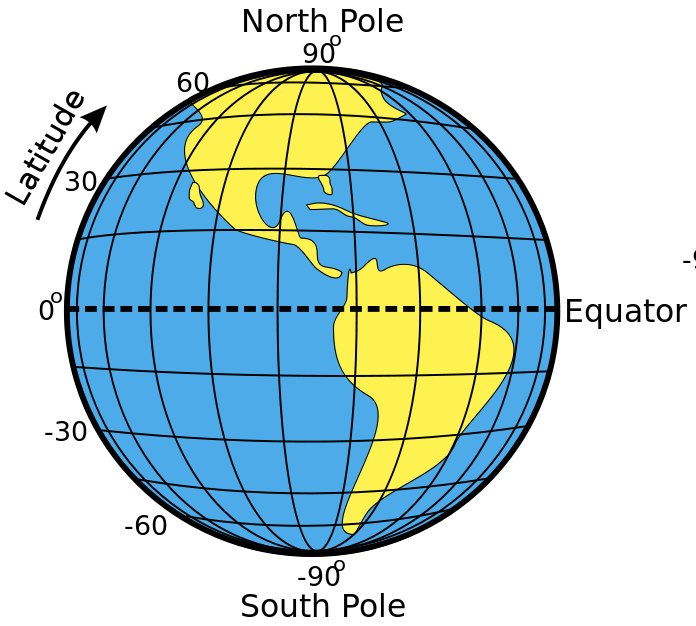
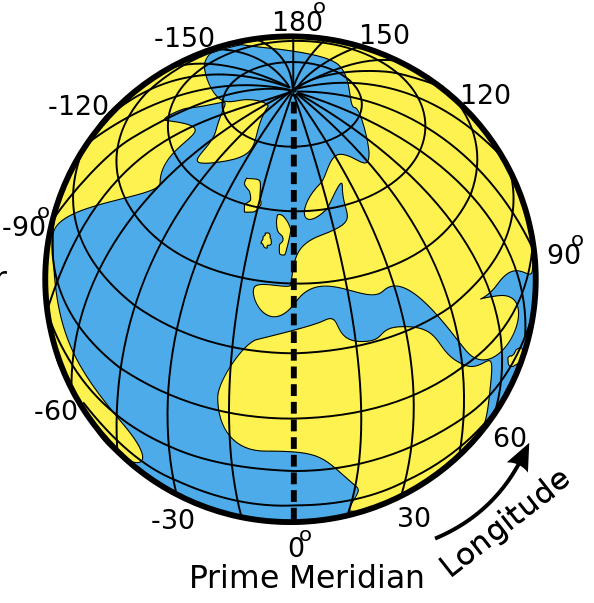
By contrast, lines of longitude run from the North Pole to the South Pole. There is no natural line of zero longitude, but by convention, Greenwich is defined as longitude zero. Points to the west of Greenwich have a westerly longitude (e.g. 30˚W) and points the east have an easterly longitude (e.g. 10˚E). G
One degree of latitude or longitude is quite a large distance, so subdivisions are required to specify position precisely. Each degree is divided into 60 minutes. A minute is denoted by a single quote mark: 1’. So, longitude 10˚ 30’ W is halfway between 10˚W and 11˚W.
Each minute can be subdivided again into 60 seconds (60”), but in practice, decimal minutes are more commonly used. So a longitude might be given as 4˚39.6’W.
Again, an example is the easiest way to explain how latitude and longitude are used in practice.
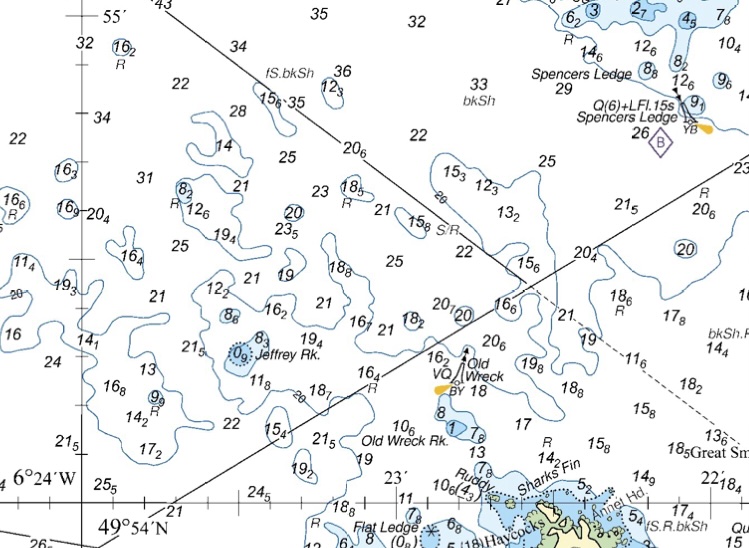
What is the position of the Old Wreck buoy?
Latitude will be shown vertically up the chart, along scales on the sides and on some grid lines. We can see that latitude 49˚54’N is shown in full, and 49˚55’N is indicated by a 55’ mark. Between these, there are 10 divisions, so each must be 0.1 of a minute. The latitude of the buoy is 49˚54.2’N
Longitude is shown similarly horizontally across the charts. Note that because this chart is of an area west of Greenwich, the numbers increase from right to left. We can see 6˚24’W marked in full, with 23’ and 22’ also shown. The longitude of the buoy is 6˚22.8’W.
The position can be specified as 49˚54.2’N 06˚22.8’W (we’ve included a zero ahead of the 6˚ just to make it clear there’s not a number missing).
We’d say this (e.g. over VHF) as “four-nine degrees, five four decimal 2 minutes north, zero-six degrees, two two decimal eight minutes west”.
Note that, in contrast to grid references, the northerly coordinate is given first. Directions (north, south, east or west) are always included.
1.4 Distance, speed and time
It is useful and good practice to estimate the time that should be taken to get to the next waypoint on our route. This enables estimation of how far has been paddled (e.g. ‘we’re half way there’) and acts as a check on the speed of the group. Slow progress could indicate tired paddlers or an unexpected tidal stream in the opposite direction.
1.4.1 The units of the sea
Distances on the sea are measured in nautical miles. One nautical mile is defined as one minute of latitude. This means that, as well as the chart scale, the latitude scale on the chart can be used measure distance. For example, on the example chart below, the distance from the Old Wreck buoy to Spencers Ledge Buoy is about 0.7 nautical miles.
Never use the longitude scale to measure distance. A glance at a diagram showing lines of longitude shows that they converge at the poles. So a minute of longitude varies from about 1,855 m at the equator to zero at the poles. This makes the longitude scale useless for measuring distance.
How far is it from the Old Wreck Buoy to Jeffrey Rock? I measure the distance on my screen with a ruler as 42 mm - your measurement may differ, by the important thing is that this is about 4 and a half ticks up the latitude (vertical) scale on the map. 10 ticks up this scale is 1 minute of latitude, or 1 nautical mile. So, the distance is 4.5/10 = 0.45 nautical miles.
One nautical mile is approximately two kilometers and is very close to one statute mile. Kilometers are a more natural unit to use on OS maps with 1 km squares, but it helps to think of 2 squares as (very approximately) a nautical mile.
A boat that moves 1 nautical mile in one hour is said to have a speed of 1 knot. This would be rather slow. An inexperienced group of paddlers might expect to move at 2 knots, whilst a small experienced group might cruise at 3 knots. A fast and fit paddler might be able to cruise at 4 knots and sprint at 5 knots for a short period.
1.4.2 Distance, speed and time calculations
If we know how far we’re going and how fast we’re paddling, we can calculate how long it will take using Time=distance/speed.
For example, if we want to paddle 6 kilometers at 2 kilometers per hour, it will take 6/2=3 hours. If we want to paddle 12 nautical miles at 3 knots (i.e. 3 nautical miles per hour), it will take 12/3= 4 hours.
If we know the distance between two points on our route and how long it took to get between them, we can calculate our speed: Speed=distance/time.
For example, if it took us half an hour to paddle 1 nautical mile, our speed is 1/0.5=2 knots.
It’s helpful to remember that:
| At | We cover 1 nautical mile in… | We cover 100m in ~ |
|---|---|---|
| 2 knots | 30 minutes | 1.5 minutes |
| 3 knots | 20 minutes | 1 minute |
| 4 knots | 15 minutes | 48 seconds |
So, for example
- 2 miles at 3 knots will take 2 X 20 = 40 mins
- If we cover 1.5 mile in 45 minutes, we’re travelling at 2 knots
- 400m at 3 knots will take 4 X 1 = 4 minutes.
As a guide:
New paddlers in general purpose boats / SUPs / canoes might travel at 2-3 kilometers per hour and want to cover 6-10 kilometers (3-5 miles) of flat water in a day
Regular paddlers in general purpose boats / SUPs / canoes might paddle at 2 knots / 4 kilometers per hour and want to cover 8-15 km (4-8 miles) in a day
A less experienced group of sea kayakers might paddle at around 2 knots / 4 kilometers per hour and want to cover 4-6 miles in a day
A more experienced group might paddle at 3 knots and cover 10-12 miles (20 if they’re fit and keen)
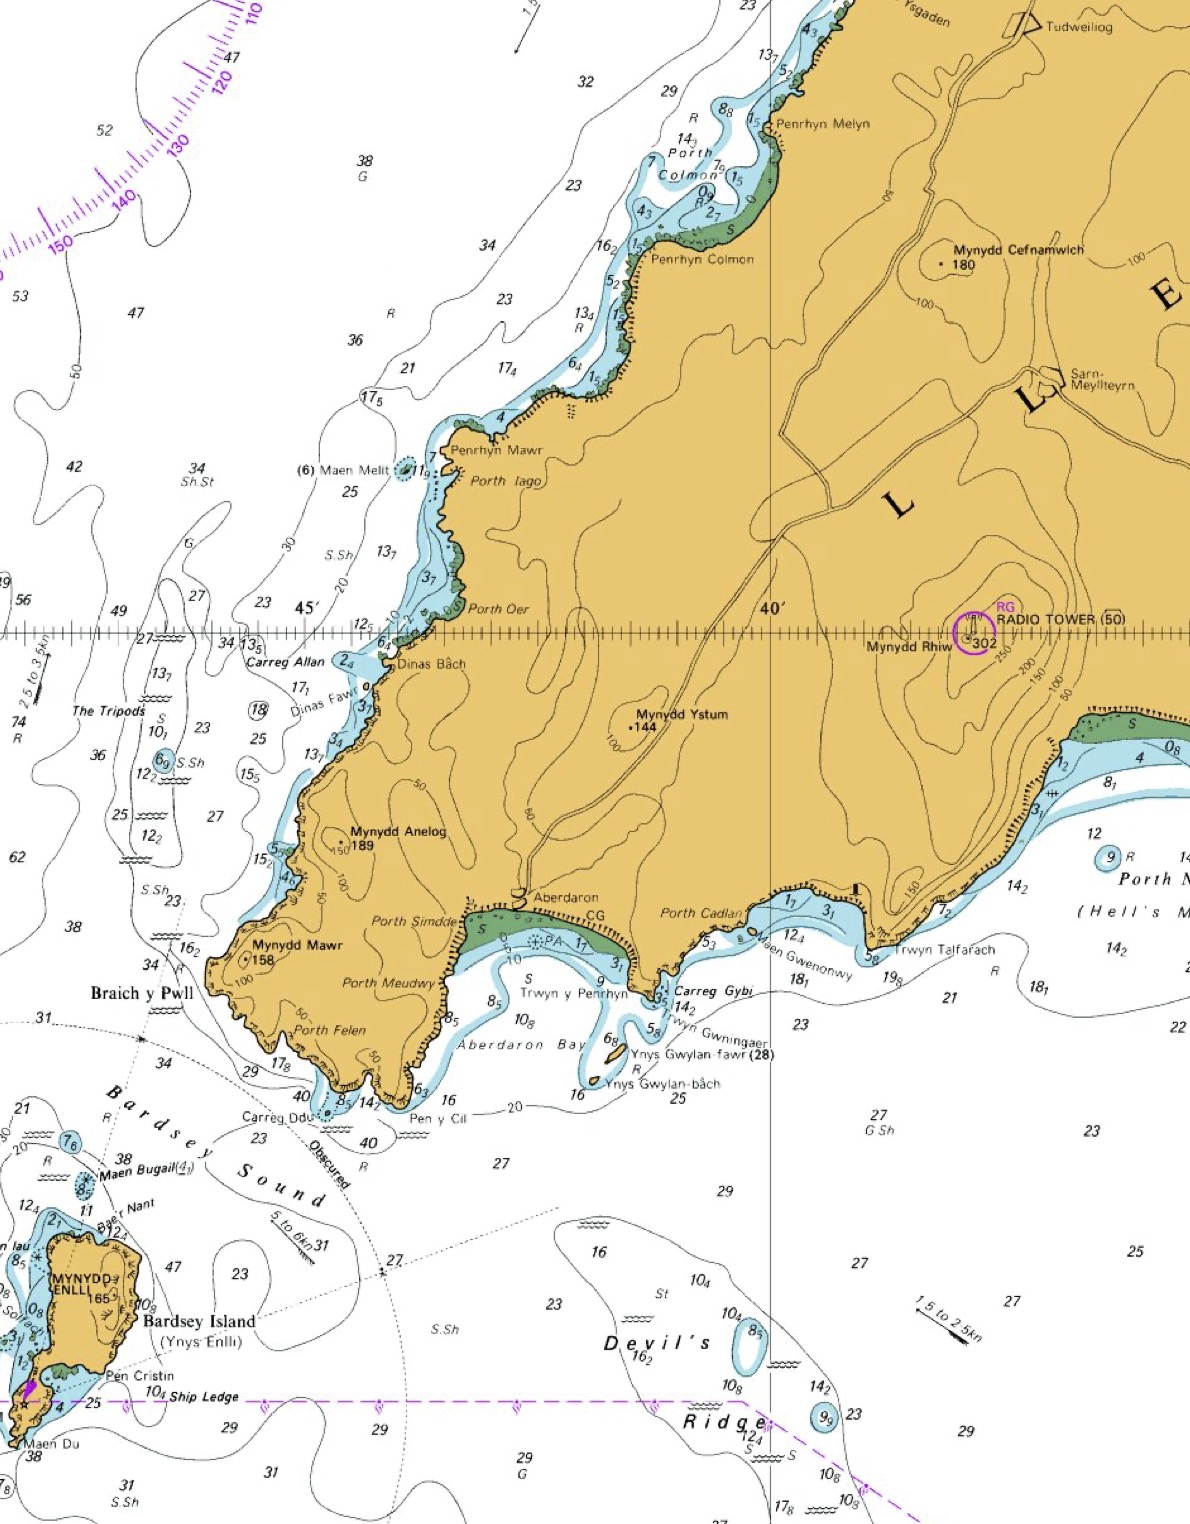
How long will it take to paddle from Portloo to Old Town at 2 knots?
The distance is a little tricky to measure around the wiggly coastline. It is around 6 grid squares = 6 km. 6 km is approximately 3 nautical miles.
Time taken = distance / speed = 3 / 2 = 1.5 hours = 90 minutes
Or, using the numbers given above, time taken = 3 miles X 30 = 90 minutes
1.5 Navigational marks
To assist the navigation of ships, navigational marks such as lighthouses, buoys and beacons are placed around the coastline. Because kayaks can operate in very shallow water, these aren’t useful to us in the way that they were intended for large vessels. However, they do provide useful landmarks if you’re carrying the nautical chart. A basic understanding of what the main buoys mean will help you understand where larger vessels are likely to go and thus help you avoid them.
Lateral marks are used to mark the edges of shipping channels – for example into and out of a harbor. As a big ship enters a harbor, red can-shaped port-hand buoys will be on the left, whilst green conical starboard-hand buoys will be on the right.
A mnemonic to remember this is “no more cans of red port left”.
This is the system known as ‘IALA A’, used in the UK and many other parts of the world. Some areas, notably the US, use ‘IALA B’, in which the colors of the buoys, but not the shapes, are reversed.
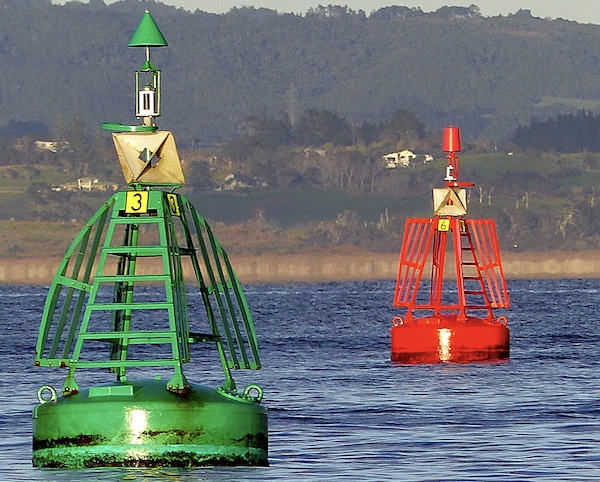
Cardinal marks indicate the presence of hazards – normally shallows that big vessels would rather avoid. A cardinal mark indicates the direction from the mark in which safe water can be found. For example, safe deep water will be found to the north of a north cardinal buoy, with the hazard lying to the south. The marks are differentiated by the orientation of two cones at the top as well as the sequence of black and yellow colors on the buoy, as shown in the diagram.
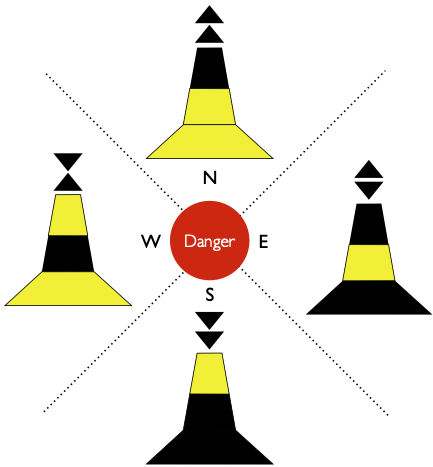
Because cardinal marks indicate shallow areas, they can sometimes be posts attached to the seabed rather than floating buoys.
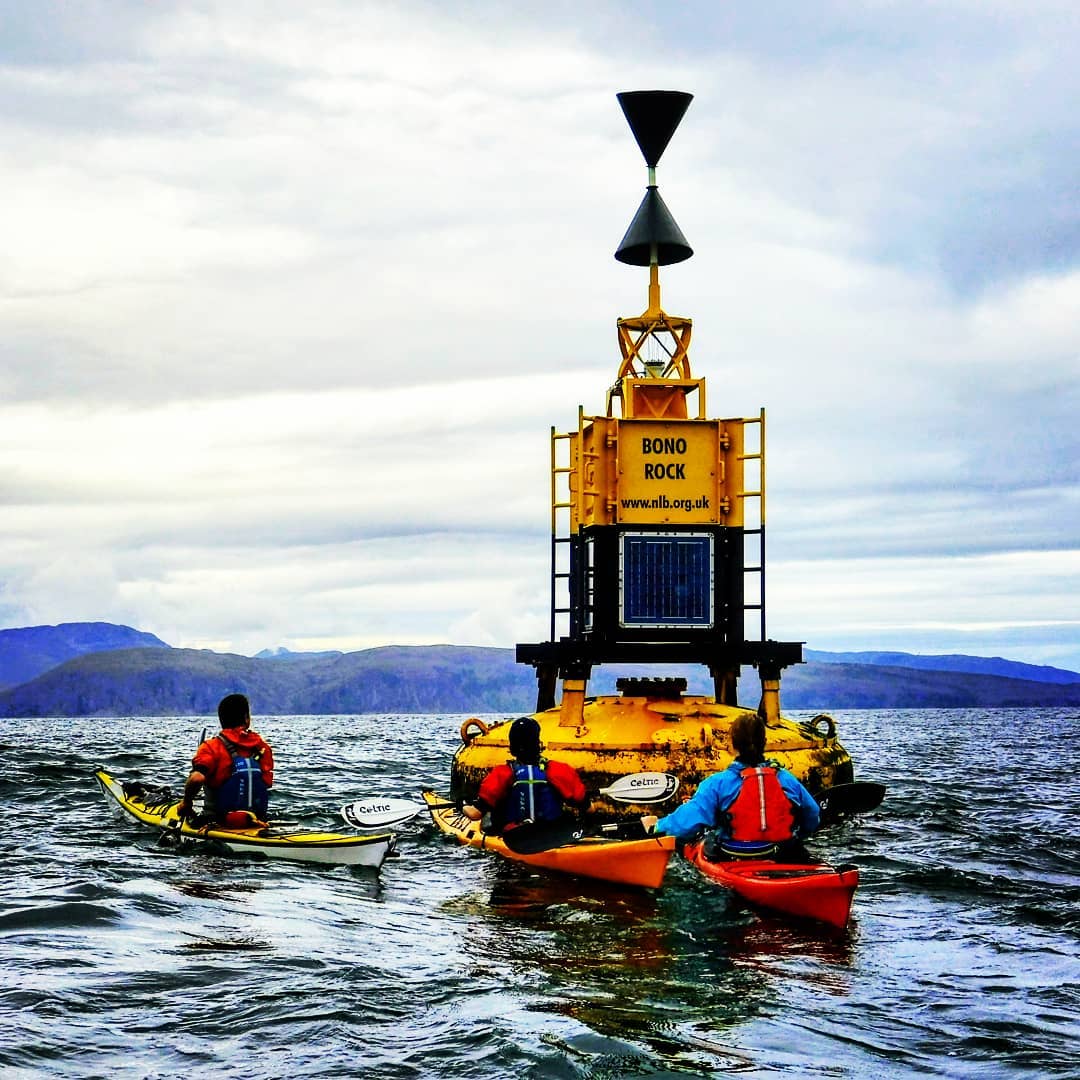
The buoy in the image below is an west cardinal mark, indicating shallows to the east.
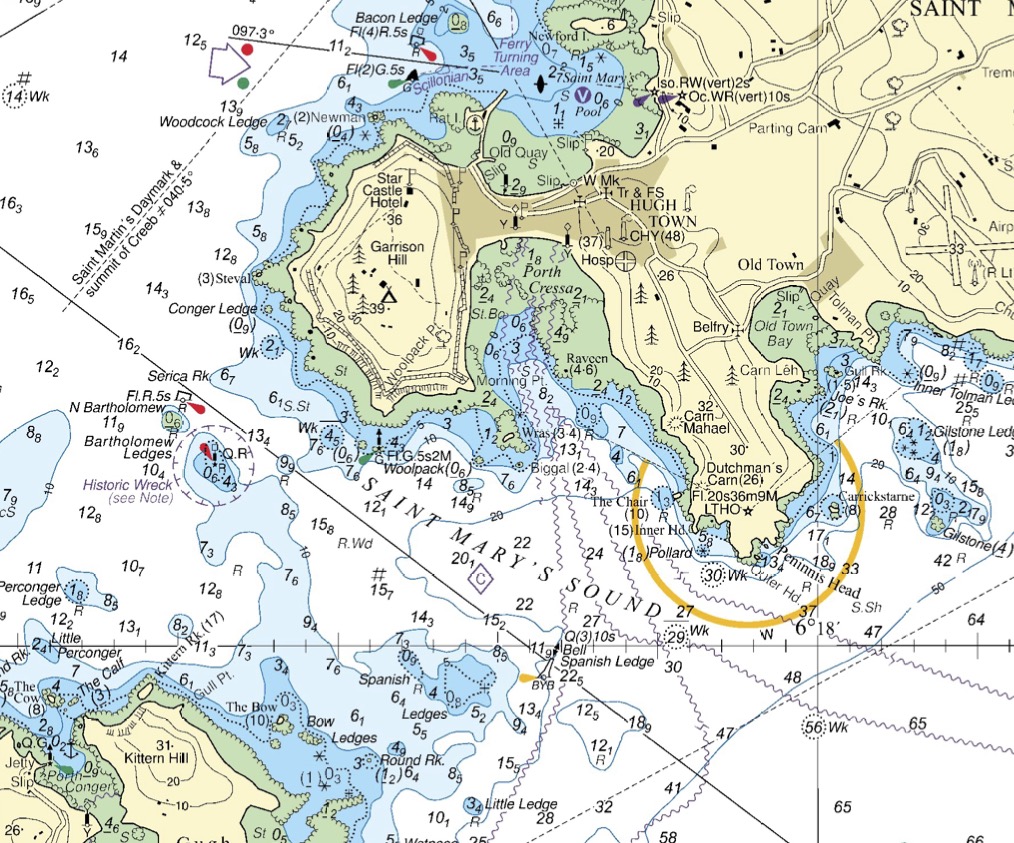
The chart extract below shows an example of how navigational marks might be positioned:
As sea kayakers, the hazards (e.g. shallows) indicated by lateral and cardinal buoys aren’t an issue for us. It’s often better to go the ‘wrong’ side to keep out the way of big vessels.
For example, imagine that we’re crossing Saint Mary’s Sound (see chart above) from Kittern Rock to the western corner of Garrison Hill. We’ll use bearings and transits to keep on course, but the red post and buoy that mark the Bartholomew ledges will be useful landmarks along our way.
As we get close to the post and buoy, we notice the ‘Scillonian’ - a 68 meter long ferry - coming around the headland of Garrison Hill. It looks like it’ll head to our right.
However, consulting the chart, we notice that the main shipping channel passes to the north-east of the Bartholomew ledges buoy - we can see the course marked with a line on the chart, and we know that the channel must go between the red Bartholomew ledges buoy and the green ‘Woolpack’ mark.
It is possible, but unlikely, that the ferry will go the south-west of the Bartholomew ledges. However, it certainly won’t go through the middle of the very shallow ledges marked by the red buoy and post. The safest place to be is close to these lateral marks - ideally between the N Bartholomew buoy and the post.
So, we paddle the short distance across to the N Bartholomew buoy and pause our crossing, taking advantage of a slight eddy forming over the shallows so we don’t need to paddle too hard into the tidal stream to hold our position. We watch the Scillonian turn. For a scary moment it points directly towards us, but it keeps turning, and soon passes to the east of us.